itp: conndev

[ITP: ConnDev & SoftRob] Lungs IV

Ok, now we’re cookin’ with fire! This is a continuation of my previous blog post.

Fabrication

Stand

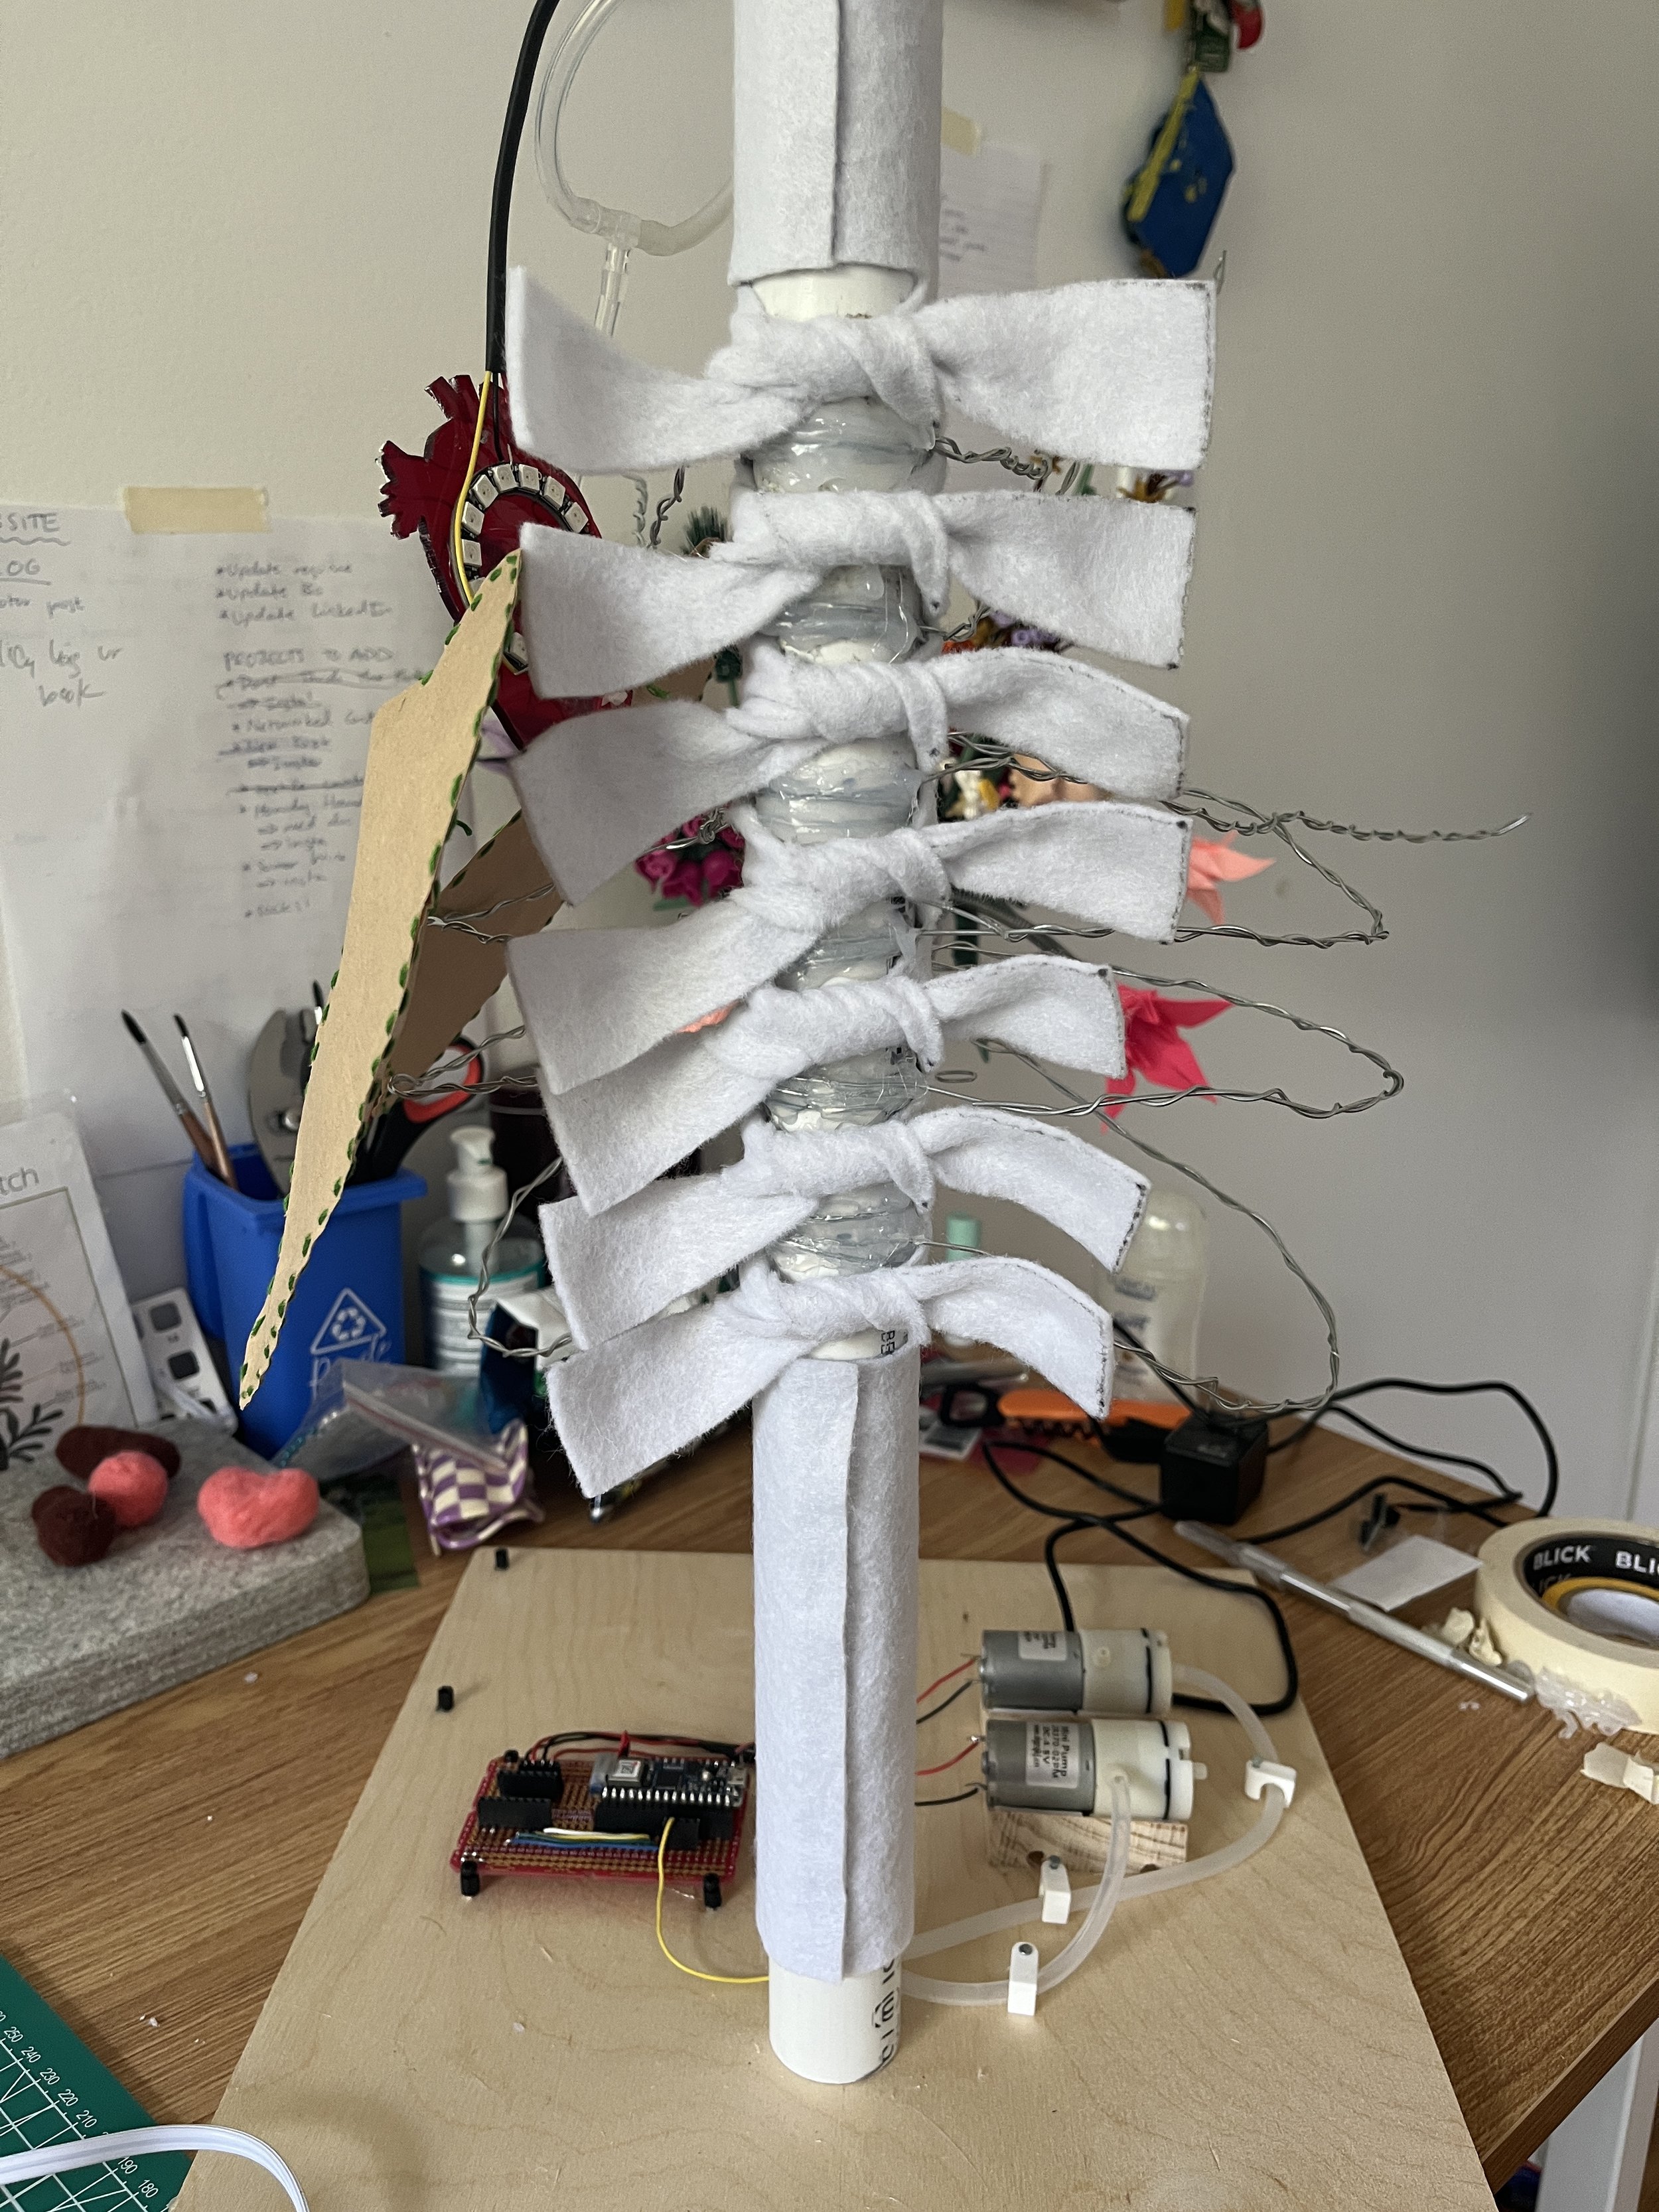
All my work this far has been flat and this ultimately needs to become an upright sculpture so I built a stand to hold the lungs and electronics in place. With some advice from the amazing Phil, I built a stand out of a 12x12x0.5 inch piece of ply wood, an 18 inch dowel, and 18 inches of PVC. I used a dremel to cut a notch out of the bottom of the PVC so that I could feed all the tubing and wires through it. The images below show the stand and the chaos of the end-of-the-year ITP floor.

Lungs

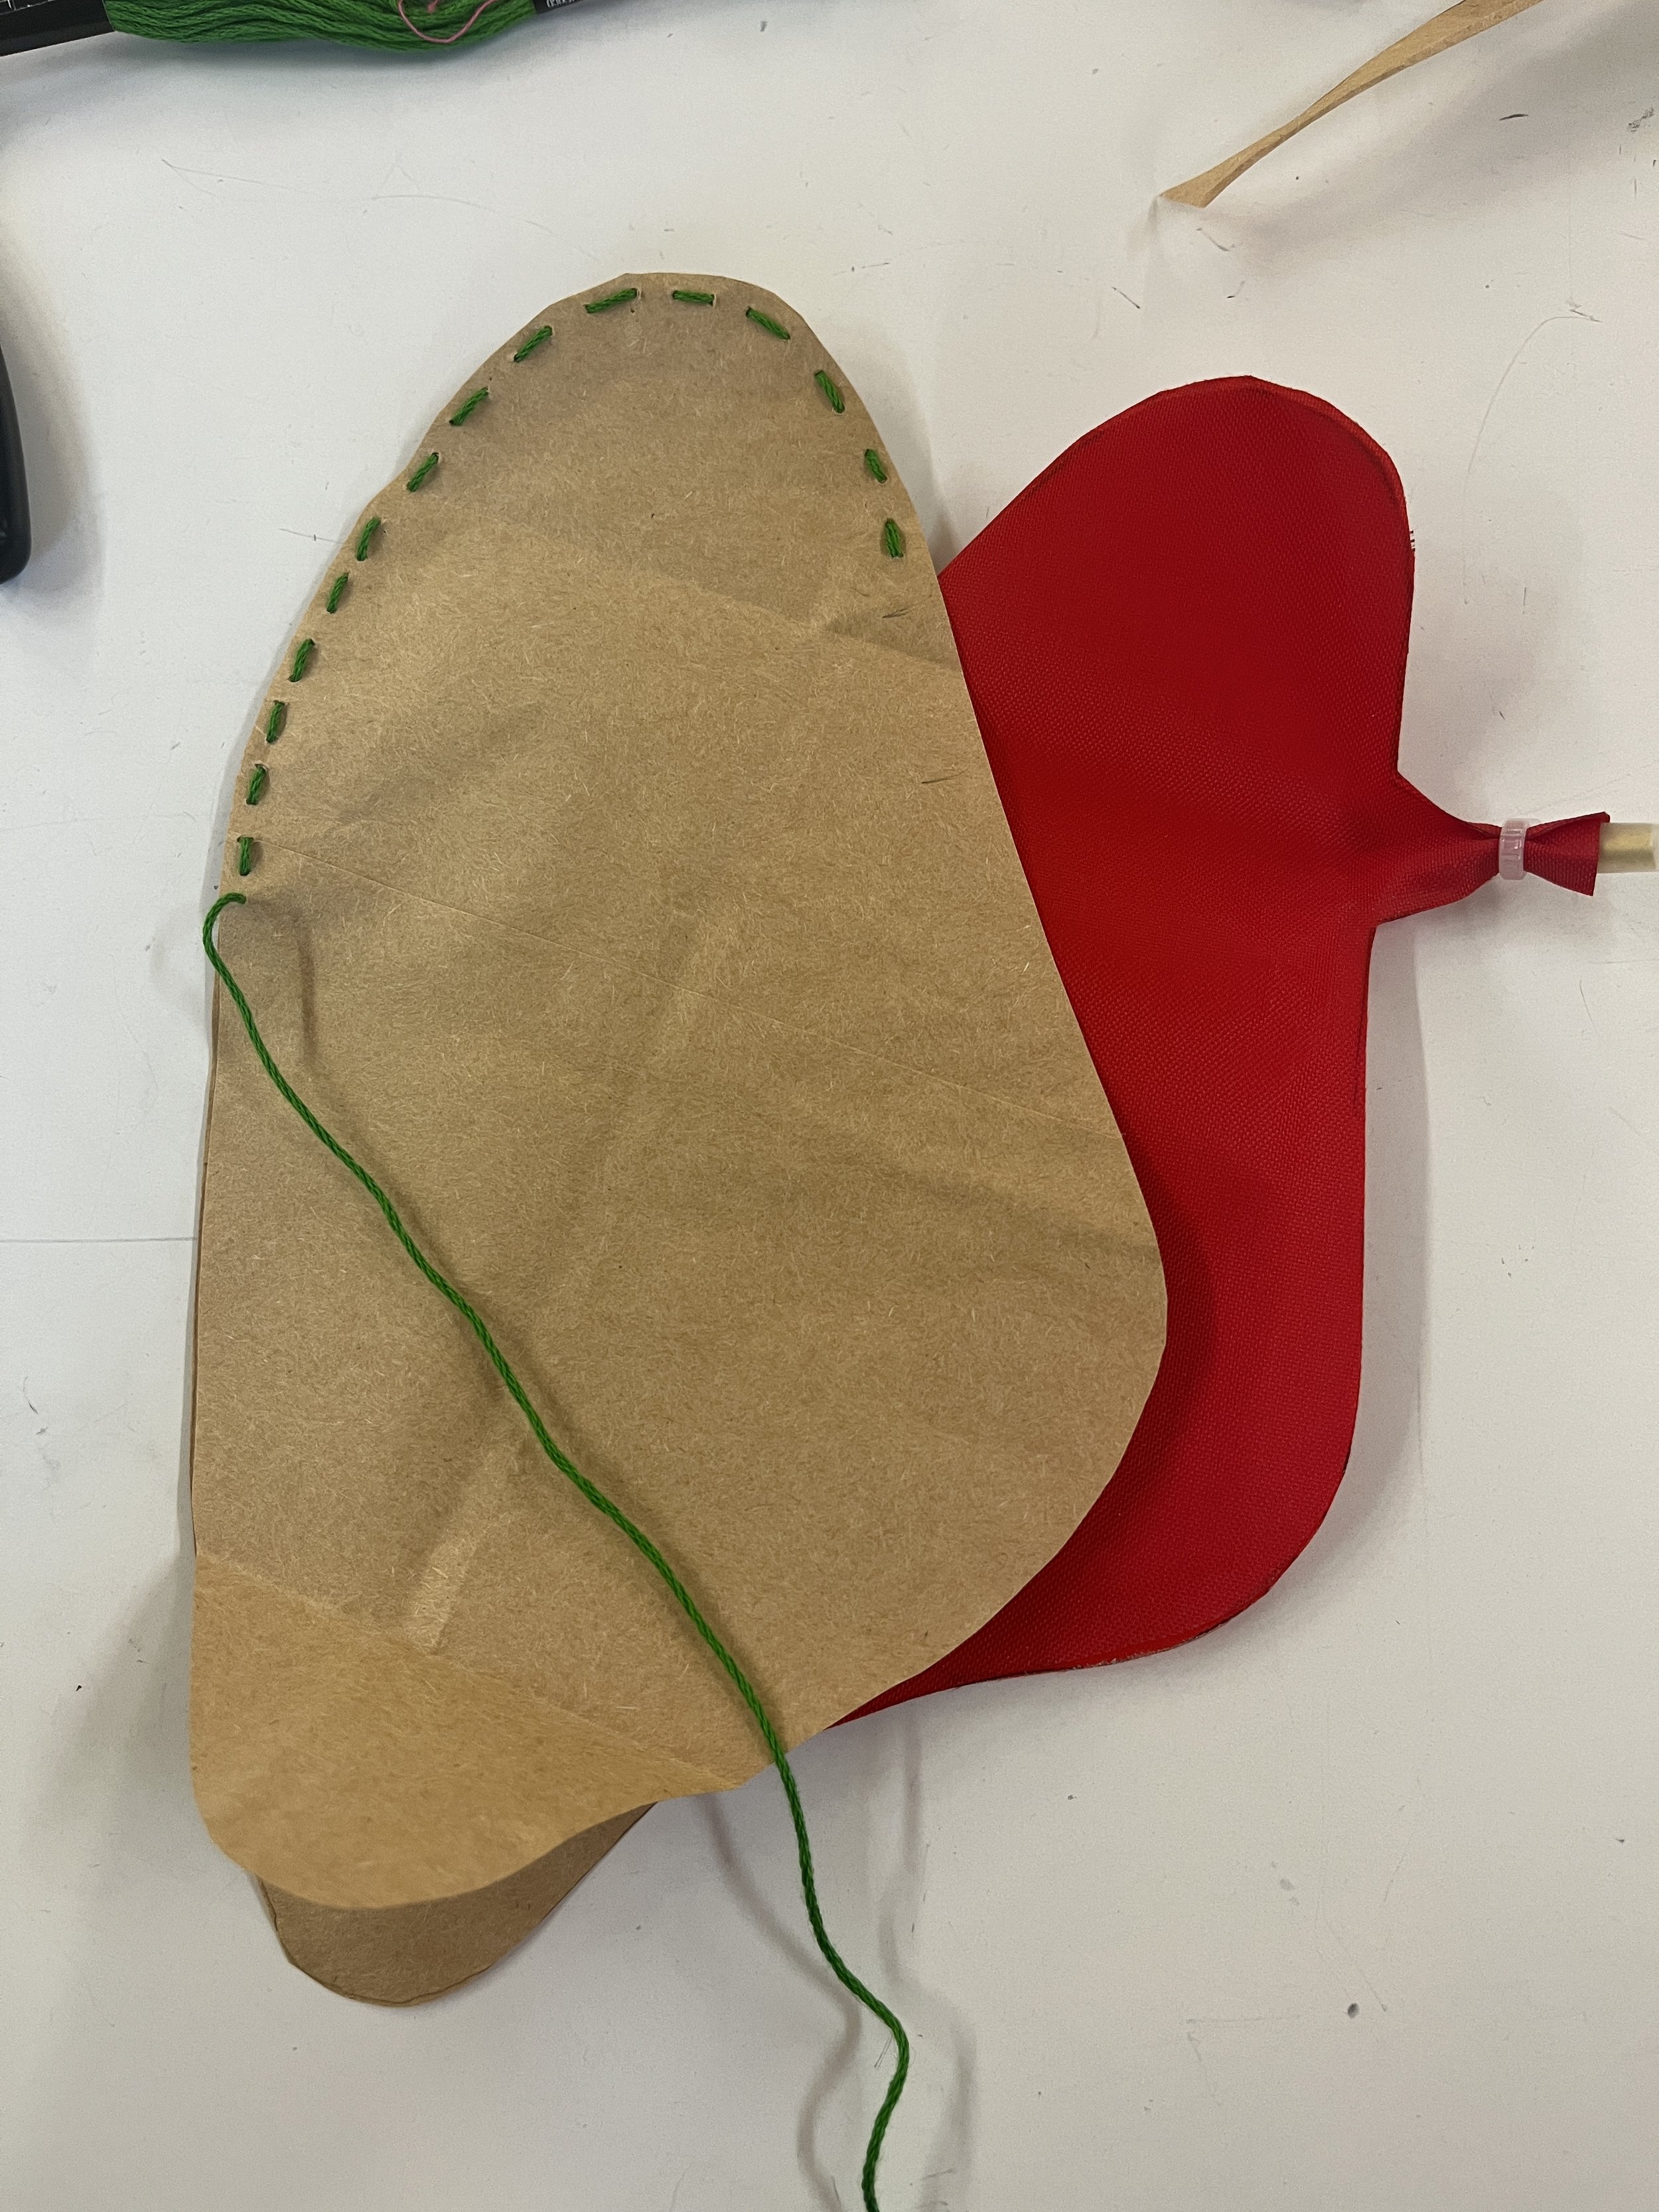
It was at this point I realized the air bags I made detailed in my last blog post (vinyl air bag with a paper covering glued on) would NOT WORK! Who knew that gluing the paper down would strop the fabric from inflating! After a quick panic attack, I re-cut and ironed some new lungs. My friend Granny suggested I could sew together a paper covering for my lungs which was a totally genius idea and something I’m already pretty good at! Voila!

Just a note, but for this pneumatic system I used 3mm silicone tubing and these little T lure locks to create the system. Also if it’s not super clear from the pictures, I attached my thoroughly-researched air bags using zip ties and a one inch piece of 3.5mm brass tubing inside.

Mounting Electronics

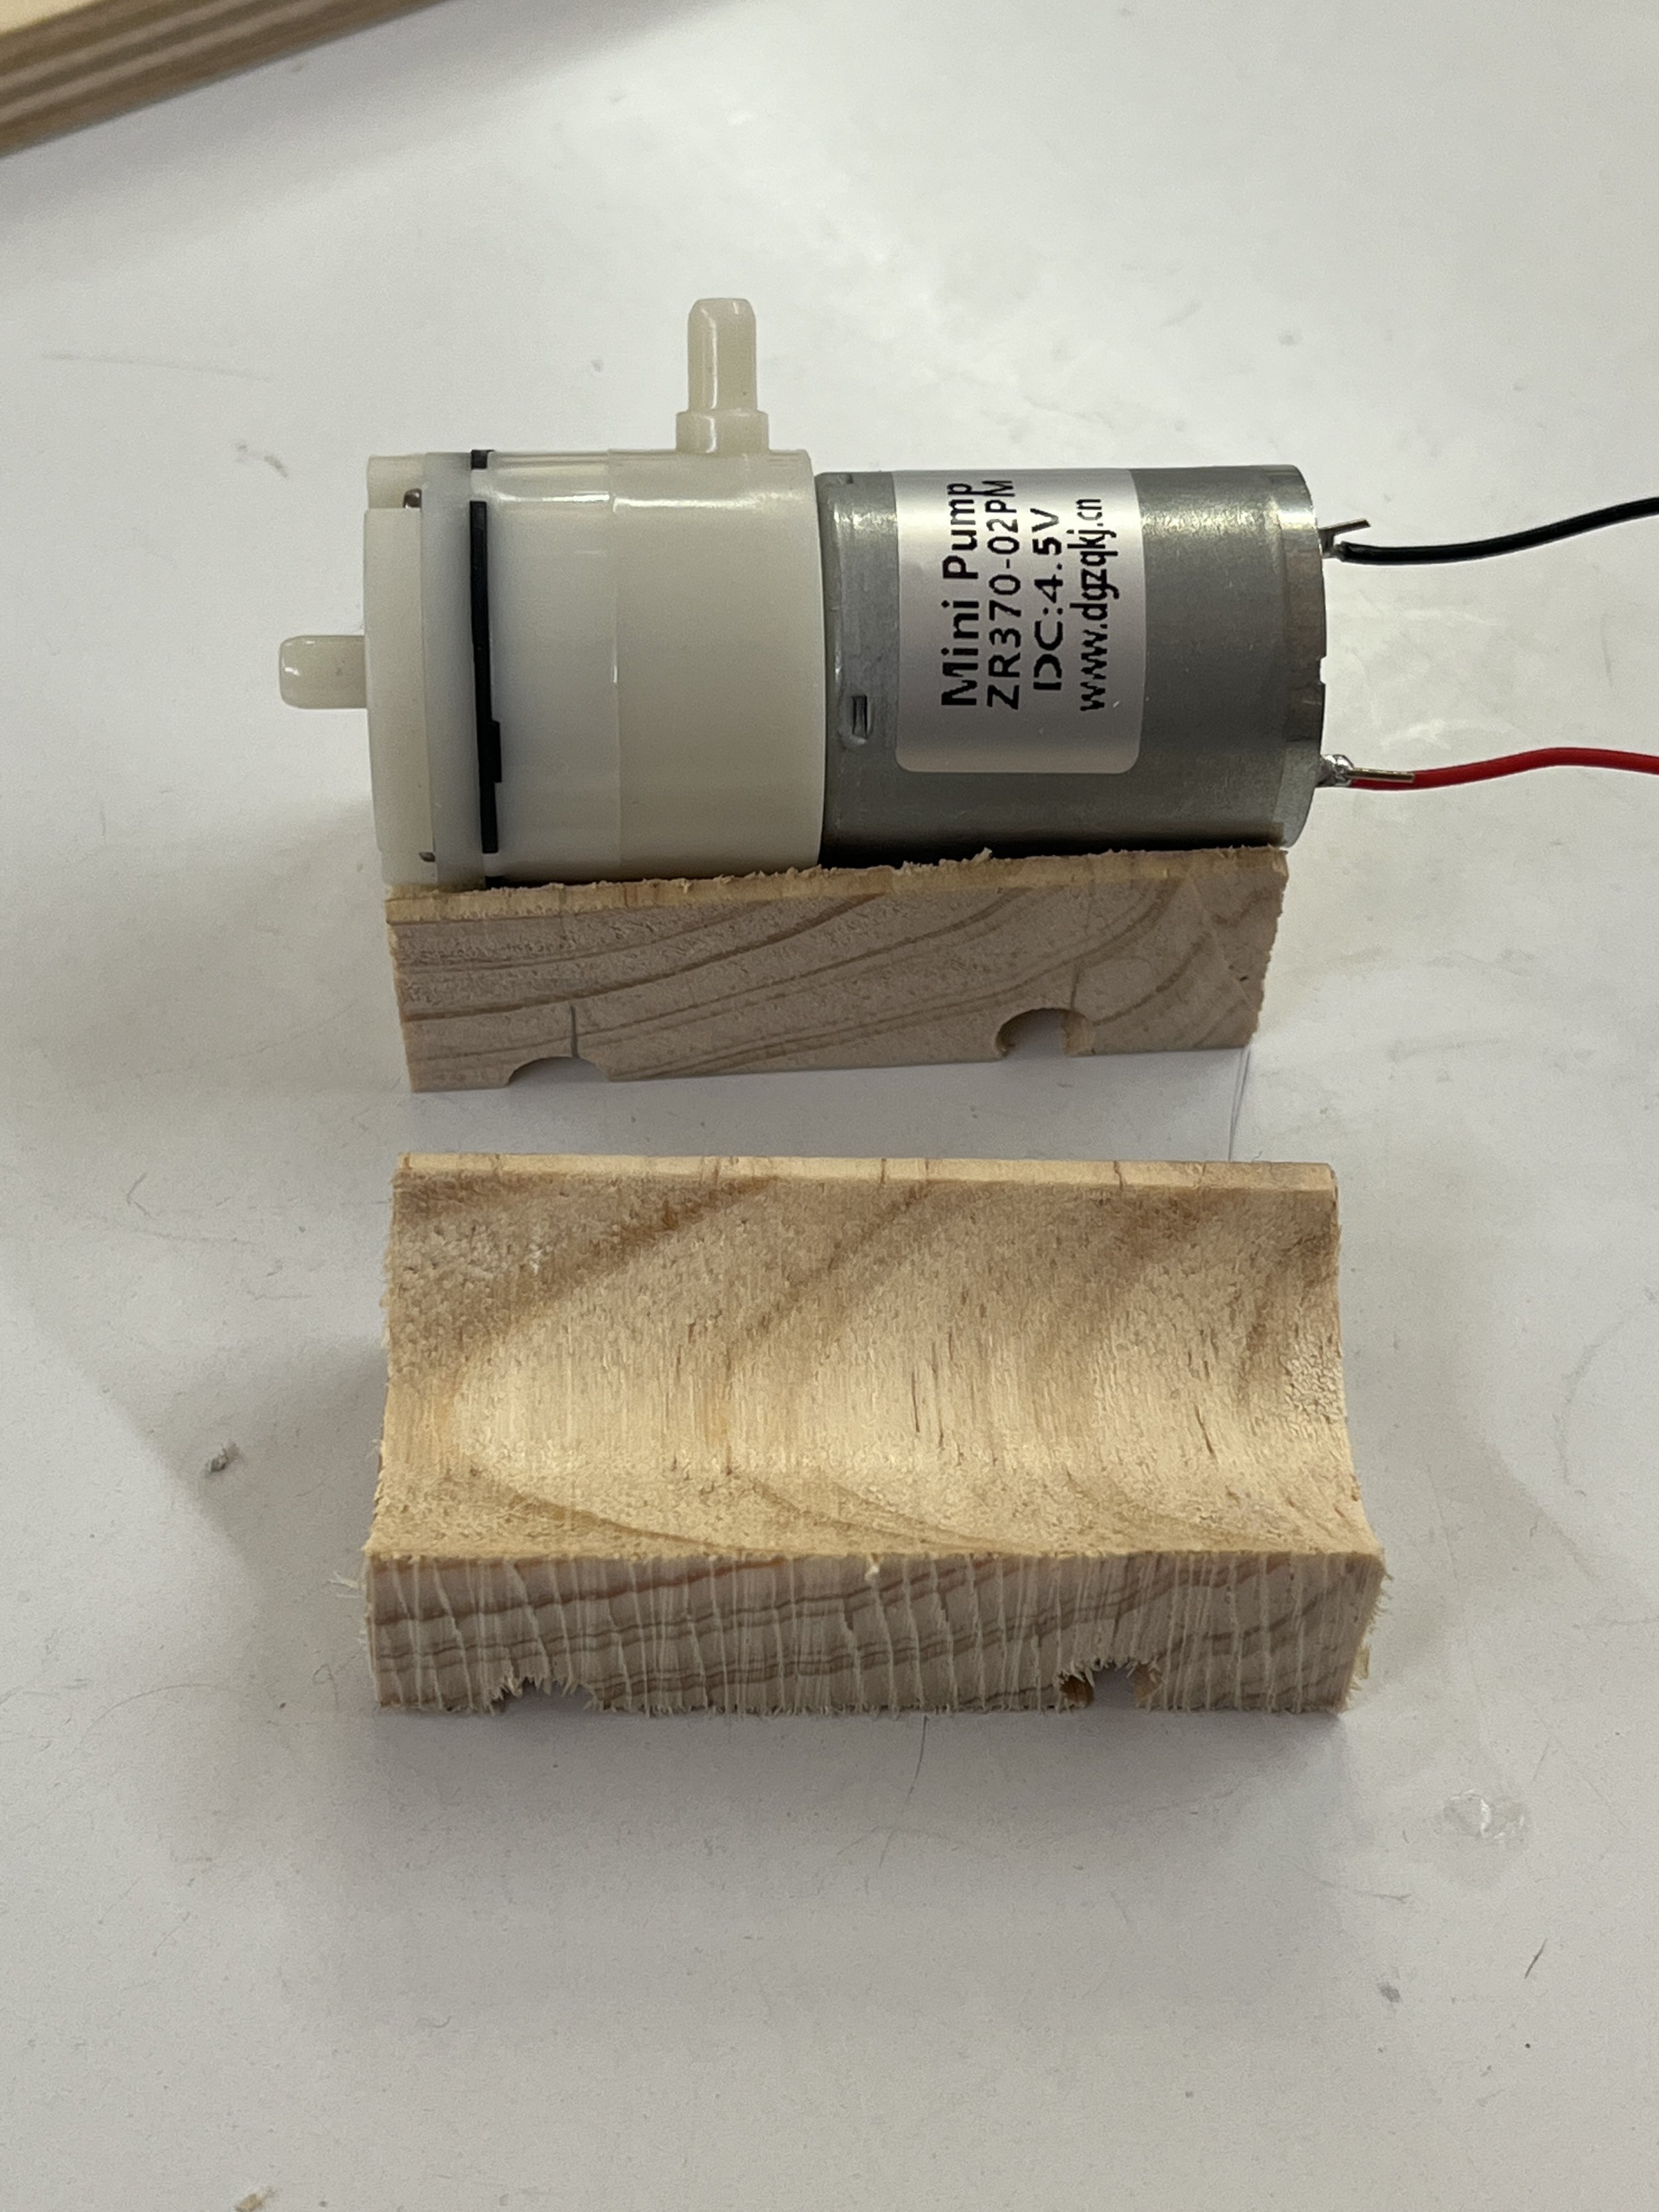
Again another fabulous idea from fab master Phil are these pump mounts. I cut them out of some scrap wood using the drill press and band saw exclusively! I attached the pumps using some double-sided foam tape. The holes on the underside of the mounts were meant for some zip ties for extra security but I didn’t end up needing them. I just screwed these mounts down to the sculpture platform.

I also soldered together a protoboard for this project so that the circuit would be more reliable than a bread board with jumper wires. I also screwed this into place using some stand offs. I cut all the wires and tubing to length and mounted them to the bottom panel using some cable clips to get a really clean setup.

Then there’s the acrylic heart. This was always intended to be a sculptural element but I realized quickly that it could be functional. I drew up this design on my iPad and etched it with the laser cutter. I glued a ring of neopixels onto it to indicate the air quality and also serve as a heart beat to indicate the sculpture is still … sculpturing during the off time of the air pumps.

Ribcage

I feel like building the ribcage was really the art part. It was a little daunting at first because I had no idea what I was doing but eventually the sculpting became really organic and freeing! I’ll try my best to explain the process.

Basically, I got this 18 gauge armature wire from Home Depot. I cut it to length using wire cutters and doubled it up and twisted on both ends. I knew I was going to make 6 ribs so I had those positions marked on the pipe. I wrapped the middle part of the wire around the pipe twice and desperately hot-glued it into place. It was a little messy at first and I definitely lost feeling in my finger tips over time, but the hot glue really worked for this build!

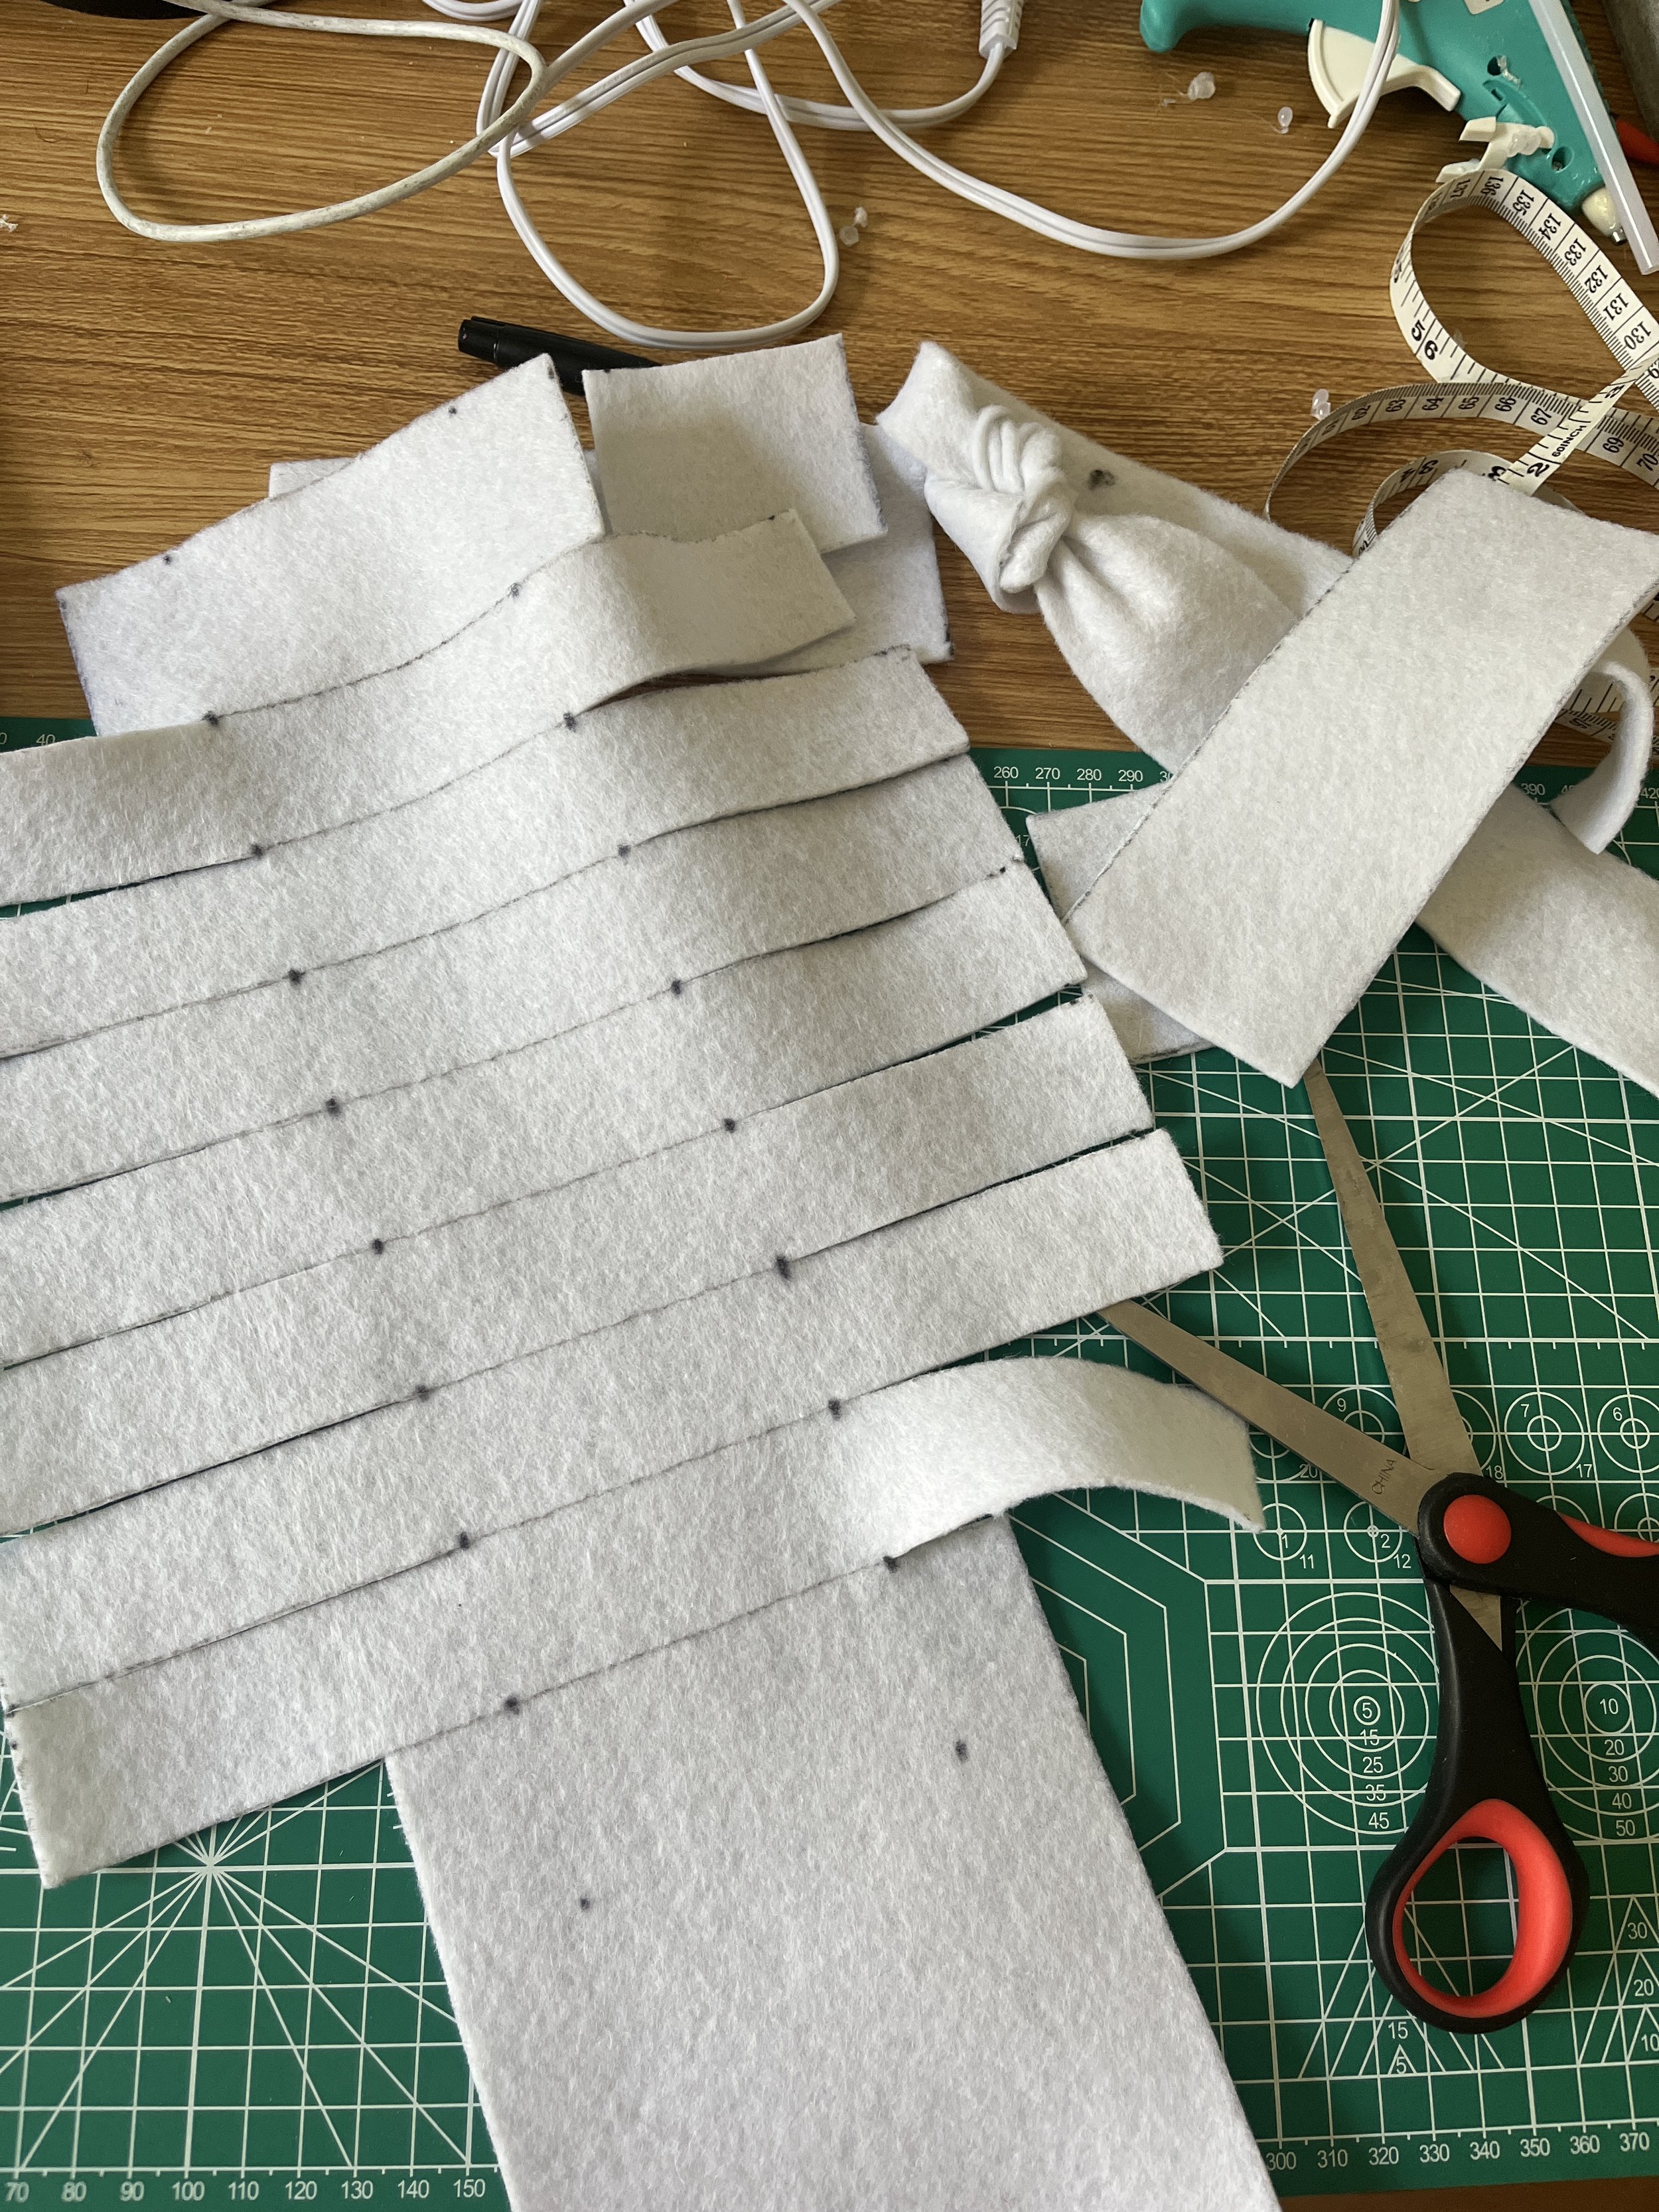
To cover up the pipe I used some white felt. I did a lot of measuring, drawing, and cutting and came up with this pattern. I hot glued it in place and knotted the strips around the ribs. Admittedly, I took some inspiration from tie blankets even though I’ve never made one myself but I thought the knotted felt would make for a good abstraction of the human spine.

Now I had a soft-presenting spinal column I wanted to achieve the look of soft ribs too. I had originally planned to needle felt the wire ribs but I wasn’t sure of the logistics now that the wire was free-floating and it seemed time consuming. I pivoted and bought some white yarn from Michaels and just wrapped it around the wire. I think the yarn would make it easier to felt onto the ribs in the future.

Code

So I think I’ve been kind of glossing over the additions to the code week-by-week, but here are some important milestones:

  • First, I integrated the pump and API code. This means that at a specified interval, the Arduino will get the AQI data from the OpenWeatherMap API and run the pumps.

    • If the AQI is bad, the rate the pumps switch from suck to blow is faster than if the AQI is good.

    • Remember I’ve implemented a watchdog timer, so that needs to be reset accordingly!

  • I’ve also implemented the neopixel ring functionality

    • It does some indication at the start of the code as to the status of the internet connection.

    • It does a light up animation when it grabs new data from the API. The color of the pixels also indicates the current air quality. Red LEDs indicate an AQI of 5 which is really bad. White LEDs indicate an AQI of 1 which is good air quality.

    • There’s also a breathing animation that happens during the off time of the air pumps in hopes that the sculpture will still be engaging to look at during that time.

I’ve also uploaded all my code to Github and this is what is currently running on my sculpture.

Final Product

Pneumatic IoT sculpture

A breathing sculpture made out of wood, PVC, wire, and textile. The beating heart changes color and is connected to the internet. It periodically checks the air quality of my hometown in Arizona. Depending on the quality, the breathing turns from frantic and labored to soothing deep breaths. This project is a reminder that what we put into the world will eventually come back to us.

The idea for this piece was inspired by my mom. Though I haven’t lived with her for many years now I still love her so much. At the start of the pandemic she developed a chronic cough. It was really worrisome because it persisted for years. My dad took her to pulmonologists, put a humidifier in each room, and even replaced the windows and screens in our house. She doesn’t suffer from an intense cough anymore, but my parents are convinced it’s because of the worsening air quality in Mesa, AZ. Anyways, it was a very special moment to have my family come to the ITP Spring show and have my mom see my sculpture in person … on Mother’s Day. I can’t make this stuff up! :’)

Future Improvements

  • Bigger and better lungs. More noticeable breathing. Would stronger pumps do the trick? Do I need to design a custom pneumatic actuator? Should I use a different material that’s crinkly/noisy maybe?

  • Add in a cough functionality and threshold.

  • Build an interface to customize the location, potentially dials and screen for changing lat and long.

  • Retry making ribcage by felting

    • I intentionally constructed the ribs so that the PVC pipe can be removed (without disturbing the electronics and pneumatics) and start over

Resources

https://www.youtube.com/@juliesfeltedfriends/featured

https://www.youtube.com/watch?v=0I91vk6BaZ8

https://www.youtube.com/watch?v=h6m3pUeebPg

Special Thanks

Phil Caridi, Kari Love, Tom Igoe, Amitabh Shrivastava, Granny Liu, Kay Wasil

[ITP: ConnDev & SoftRob] Lungs III

This is a continuation of my previous blog post.

Connected Devices

API call errors

After doing some duration testing of my API calls I learned I had a problem. Twice I had been running my code for multiple hours and after some time I saw that I would get repeated errors from my HTTP get requests. I wasn’t able to get to the bottom of WHY this was happening because I don’t have the time for that right now, but Jeff Feddersen suggested I implement a watchdog timer. The way this works is the timer is configured to reset before a given time interval. If it’s not reset in time, the SAMD21 resets and executes the code from the top. In my code, I keep track of how many error codes I receive in a row. If it’s more than three the code falls into an infinite while loop forcing the the watchdog timeout to occur without being reset, so the whole sketch will start from the beginning when the MCU is reset.

Soft Robotics

Programmable Air? Pumps?

Once the API calls were coming in reliably, it was time to see if the Arduino Nano 33 IoT is compatible with the Programmable Air. Admittedly, this should have been one of the first things I tried because the plan was to make internet connected air pumps, but I quickly learned it wasn’t. The Programmable Air examples don’t compile for the 33 IoT, the EEPROM library isn’t compatible with the MCU. I tried duplicating the library and commenting out all the EEPROM stuff that was mainly using for storing pressure readings (I don’t need that, right?) and the timing control example compiled. I could hear the valves clicking but the pumps didn’t turn on.

This is the Programmable Air (PA) pinout. It shows that the pumps are connected to D10 and D11 of the Arduino Nano. In the switchOnPumps() function in the PA library an analogWrite for both of those pins turns on the pumps at a certain power. I checked the Arduino 33 IoT pinout and D10 and D11 don’t seem to be analog pins and a digitalWrite of those pins didn’t get the function working for me. I’m not exactly sure of what makes the Arduino Nano 33 IoT incompatible with the PA but I had to shift gears.

I had my own pumps already because step Z was to build up my own pneumatic system because the PA isn’t mine. The Adafruit product page says you can drive the pumps using a standard motor driver. I soldered header pins to the DRV8833 and wired it to my Arduino Nano 33 IoT and it worked! Don’t forget to pull the SLP pin HIGH. And then I hooked up a second pump, for inflation and deflation, AND THAT WORKED TOO! I’m a genius and reinvented the PA. Jk, the Programmable Air is much smarter than this simple setup!

The image below shows the full two pump system. To the right is a quick schematic I sketched and the circuit prototype below.

The pumps aren’t rated for continuous use so I plan to write code that only does a “breathing” cycle every few minutes.

Air bags

The paper air bags proved to be too leaky in all my past testing, so I decided to change my vision a bit. I cut the lung shapes from the vinyl fabric, sealed the edges of the air bags with an iron, and glued a paper bag skin. Fingers crossed this will work once they’re interfaced with the pumps!

[ITP: ConnDev & SoftRob] Lungs II

This is a continuation of my previous blog post.

Connected Devices

API Calls

So I have been really stuck on getting the AirNow API calls to work. In office hours we tried the “SimpleGet” sketch from the ArduinoHttpClient library and a get request to “www.airnowapi.org” returns status code -2 meaning there was an error with communication to the API. When I type curl -L ‘https://www.airnow.gov’ the command works as expected returning the html of the page in my computer’s terminal. Typing curl -L ‘https://www.airnowapi.org’ works too!

curl -L ‘www.airnowapi.org/aq/observation/latLong/current/?format=application/json&latitude=40.6924&longitude=-73.9875&date=2023-04-04T00-0000&distance=15&API_KEY={apikey} returns an API response with the AQI data in the terminal as well which is super perplexing. Using that example sketch I also learned that I am able to make SSL connections and send https requests which I thought I wasn’t able to do before.

At one point I was getting a 302 error which means a redirect was happening. I looked to this Tom example to write a function to redirect the request to the correct server address but that did not end up working either because it doesn’t seem to find the new temp server and I don’t really know enough about http requests to know what it’s looking for either…


So I GIVE UP with AirNow! I started with the Weatherbit API but after getting a free key I found that it costs $475/mo if I want to get air quality data, so no go. I found the OpenWeather API which has free current air quality data. Winner! I modified the “DweetGet” sketch and can read the full API response from the Arduino serial monitor, yahoo! The API responds on the pollutants outlined in the table below.

I’m now trying to make sense of the values it is responding with. When I open my Weather App on my iPhone I see that the air quality in Mesa, AZ is 47 which is “good” and the AirNow dashboard reads 45, so that lines up pretty well. The API calls on my Arduino say the AQI is 3…

Looking at the API documentation it shows that the AQI is on scale from 1 to 5, 3 being moderate air quality. Moving forward I can either use this 1 to 5 number or understand what the other chemical pollutants mean in terms of air quality and how I want to use them in the “breathing” of my piece.

Soft Robotics

New materials:

  • 3.5mm brass tubing

  • Zip ties

  • Stuffing

  • Latex gloves

  • Vinyl fabric

Vinyl Airbag test

Subtracted volume test

Added coke bottle volume test

I added a coke bottle in line with the inflation pump in hopes of getting the lung to inflate faster. If the pump is constantly pumping air into the bottle it should act as compressed air when opening the valve and should make the rate of air flow much faster. Even with all the time I put into constructing the Coke bottle bong, this didn’t prove to be a good solution because the tube parts were too leaky.

Vinyl lung test

I cut this lung shape out of the heat-sealing vinyl fabric. So far it seems like the most reliable and straightforward solution to making “breathing” lungs.

[ITP: ConnDev & SoftRob] Lungs I

This is a continuation of my previous blog post.

Connected Devices

AirNow API

AirNow is the US Environmental Protection Agency’s site for reporting air quality. The API makes air quality data from all over the country available by http request. Specifically, I am interested in the Air Quality Index (AQI) which reports on levels of ozone, particle pollution, and other common air pollutants.

I created an account to get an API key. Looking at the AirNow web services, you can get air quality data by zip code, but there’s a difference between a “forecast” and the “current observations” request. Here’s what a test request and response looks like using the API’s query tool:

Getting AQI with Arduino

I started with this Arduino code from Tom. I am in luck because I’m using the exact same API as the example, almost like I planned for that… ?! But jokes on me, I cannot get the sketch to work. With a few debug statements, I can see that I’m not passing the http.connected() condition. Also, it takes a really long time to get past the “http.get(route)” and “http.skipResponseHeaders()” lines.

Historically, I’ve never been able to get an SSL connection to work (idk why) so I switched the code around to http calls (not sure if I CAN do this with the AirNow API, but worth a try). That also never passes the http.connected() function.

When I “curl www.airnowapi.org/aq/observation/zipCode/current/?format=text/csv&zipCode=85215&distance=25&API_KEY=800547F9-0F0F-433E-BC00-6454026B35C8” in my computer’s terminal window this is what I get back:

I don’t really understand this response. I thought this kind of request would be a “get” and I was kind of expecting an API response back like I saw in the AirNow query tool.

Soft Robotics

I want the lungs of my sculpture to be paper bags. I’m starting to build out this project with the Programmable Air designed by Amitabh. Here are some of its specs:

  • Has 2 pumps and 3 valves

  • Can suck, blow, and vent air

  • Can achieve -0.5 to 0.5 atmospheres of pressure

When working with the Programmable Air, don’t forget to plug in a 12V power supply into the barrel jack like I did because things will not work. Also, when uploading code to its Arduino Nano be sure to choose “ATMega328P (Old Bootloader)” for the processor in the Arduino IDE. I started with the “factoryFirmware” example sketch from the PA library which lets you suck and blow air using the onboard buttons. This sketch will be a good way for me to test my paper air bags.

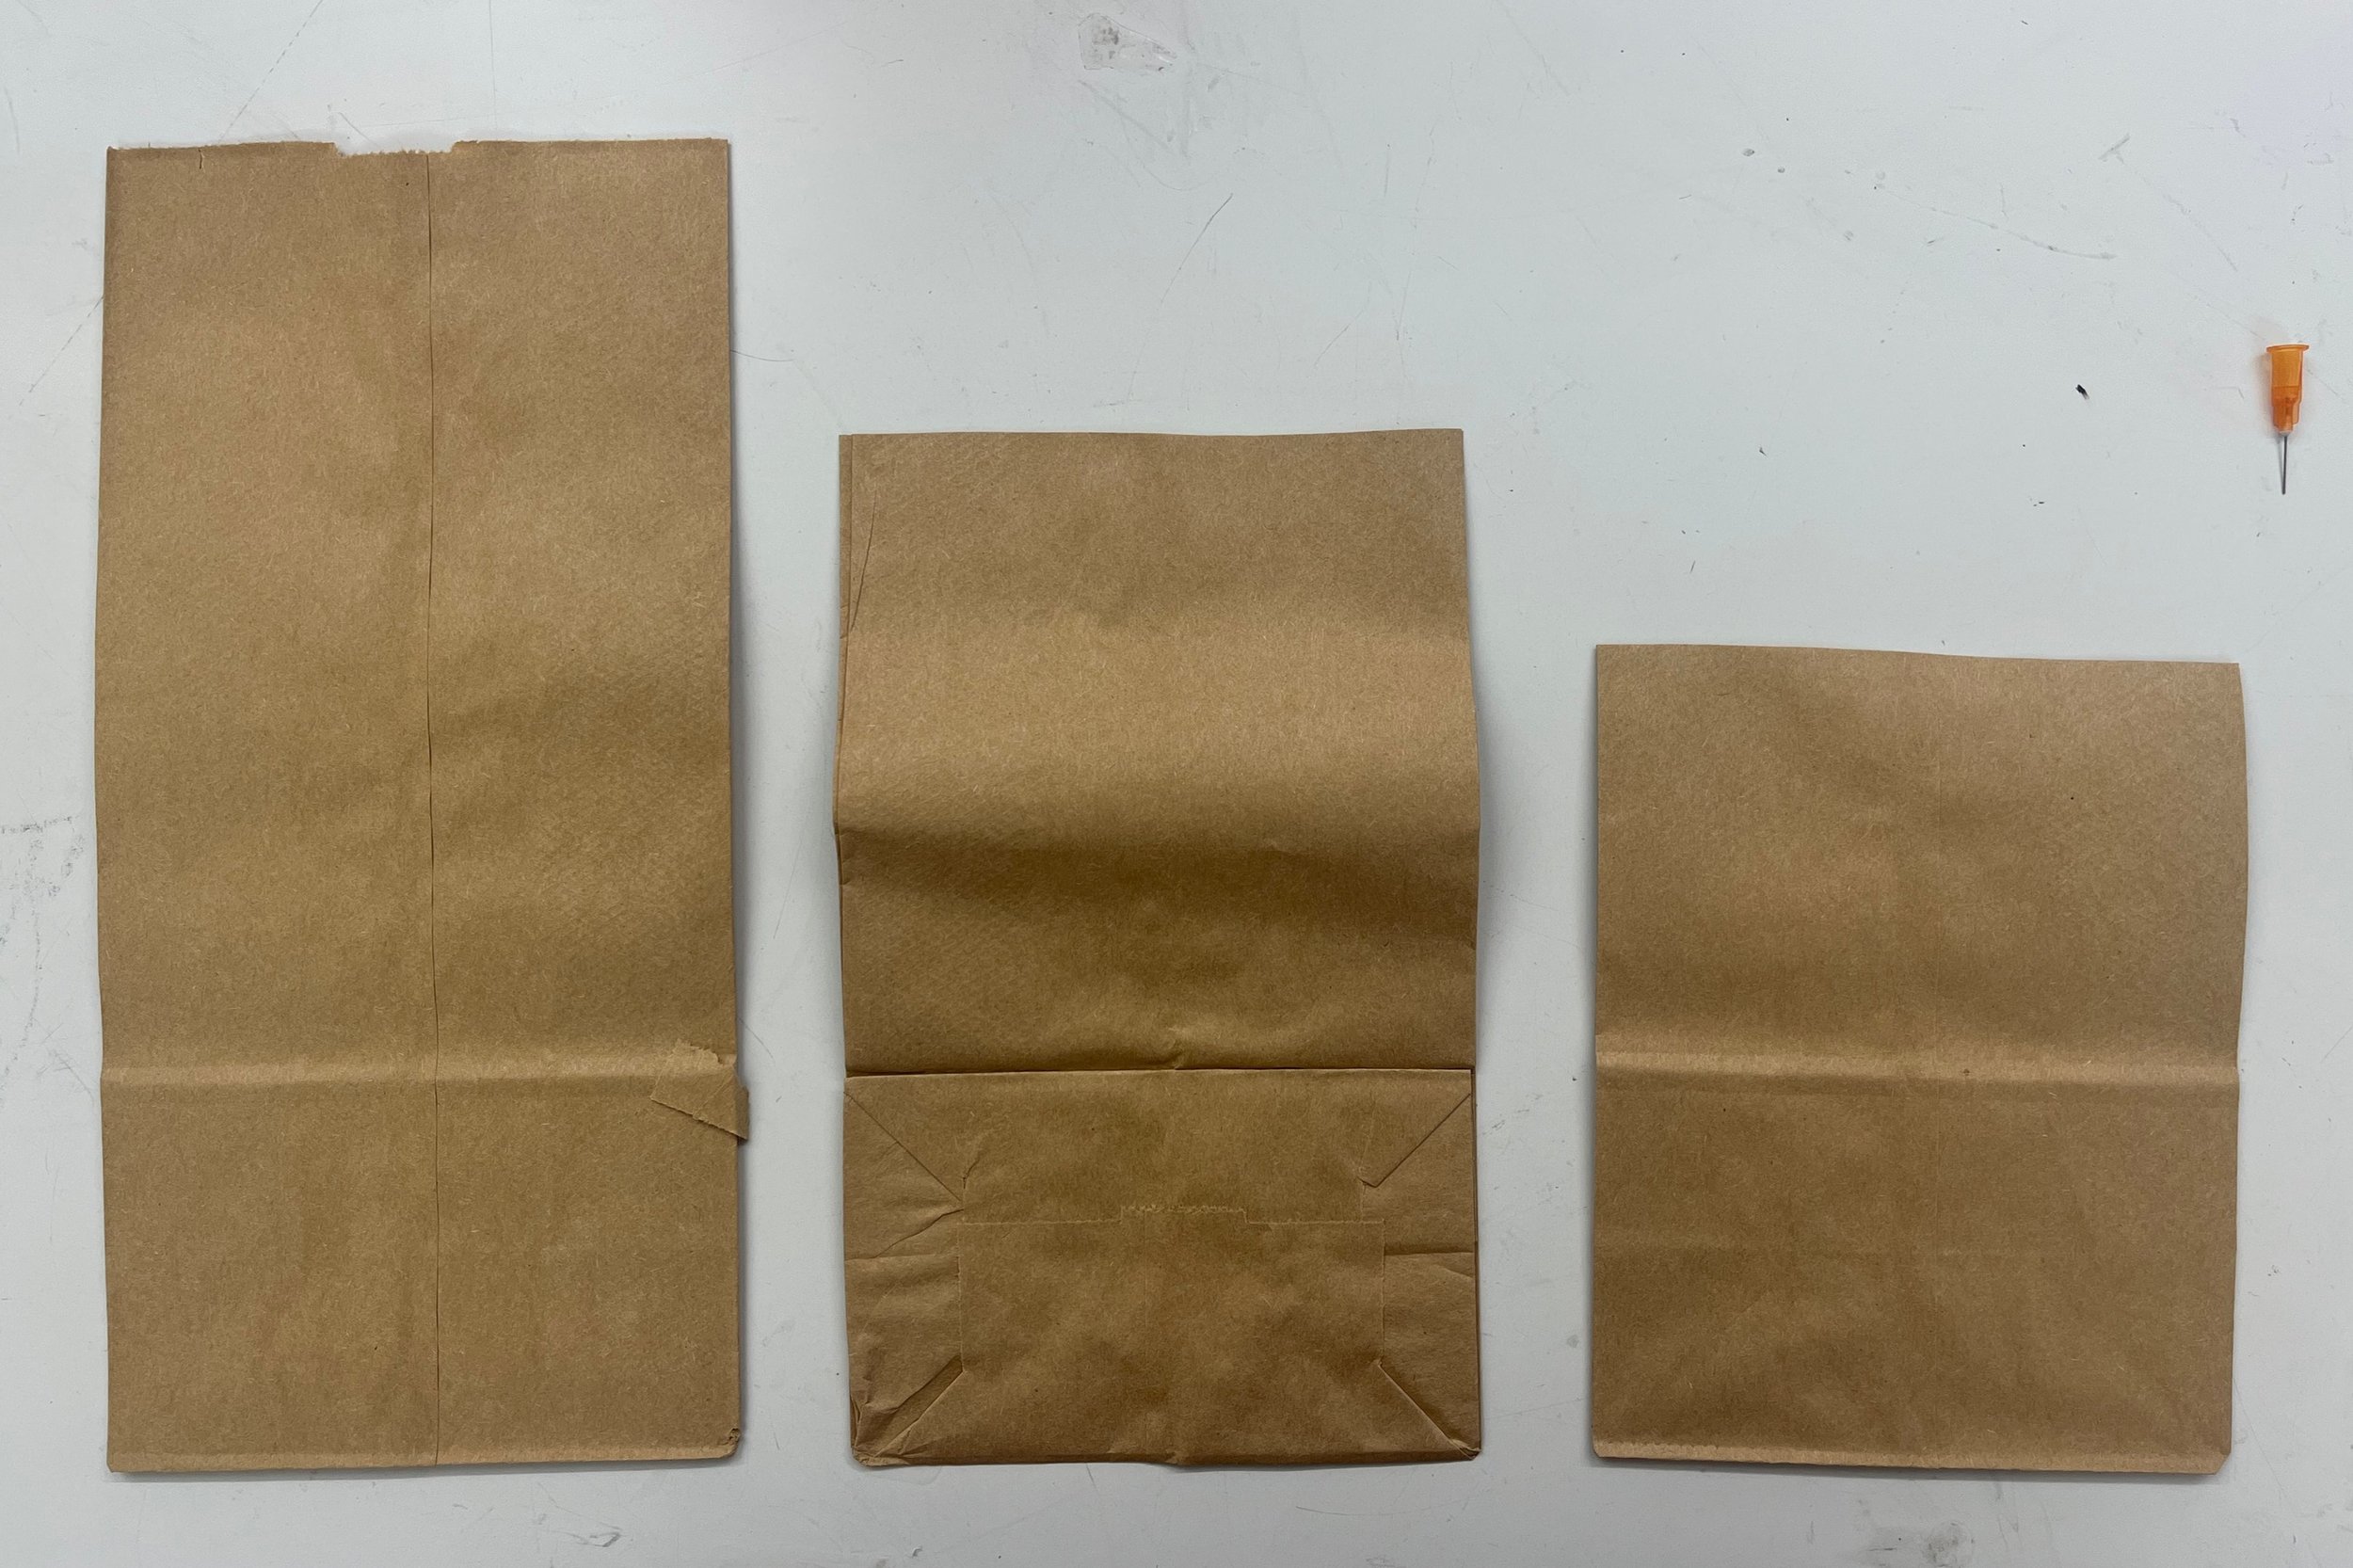
I really like the aesthetic and context of sack lunch bags, so that’s what I’d like to use for my sculpture. Below you can see the different sizes I was working with. I hooked these up to the PA and tested suck and blow.

Air bag sizes

Small airbag, did not work. Maybe there’s a leak or the material is too stiff? That’s why I tried a crumpling method…

I have some video documentation of my results, as you can see, it doesn’t really look like breathing lungs. The videos are 2x speed and the inflation/deflation was slow and subtle. The small air bag didn’t work at all, I’m thinking I must have a leak in my bags. I was also having issues with the zip ties not working and it did cross my mind that I could be tightening the zip ties too much and constricting the air flow completely.

The last thing I wanted to try out were the two “lungs”. Luckily we got this tee coupler thing from Amitabh’s lecture day which really comes in handy when you want to blow up two things at once. I didn’t need to take any video documentation of this setup because the air bags didn’t seem to change shape at all.

To get a better flow rate I could try Amitabh’s coke bottle method where a pump is constantly filling a bottle with air and a valve controls the flow to the rest of the system. I’m also thinking the volume and/or the material of the bags could be an issue but I am not sure where to begin with debugging.

Felting - First Attempt!

I watched a lot of felting tutorials this week and it really just seemed like all it is is stabbing wool with a special needle… and it is! Here’s my first try at forming some simple shapes.

[ITP: ConnDev & SoftRob] Beginnings of a Final Project

Idea

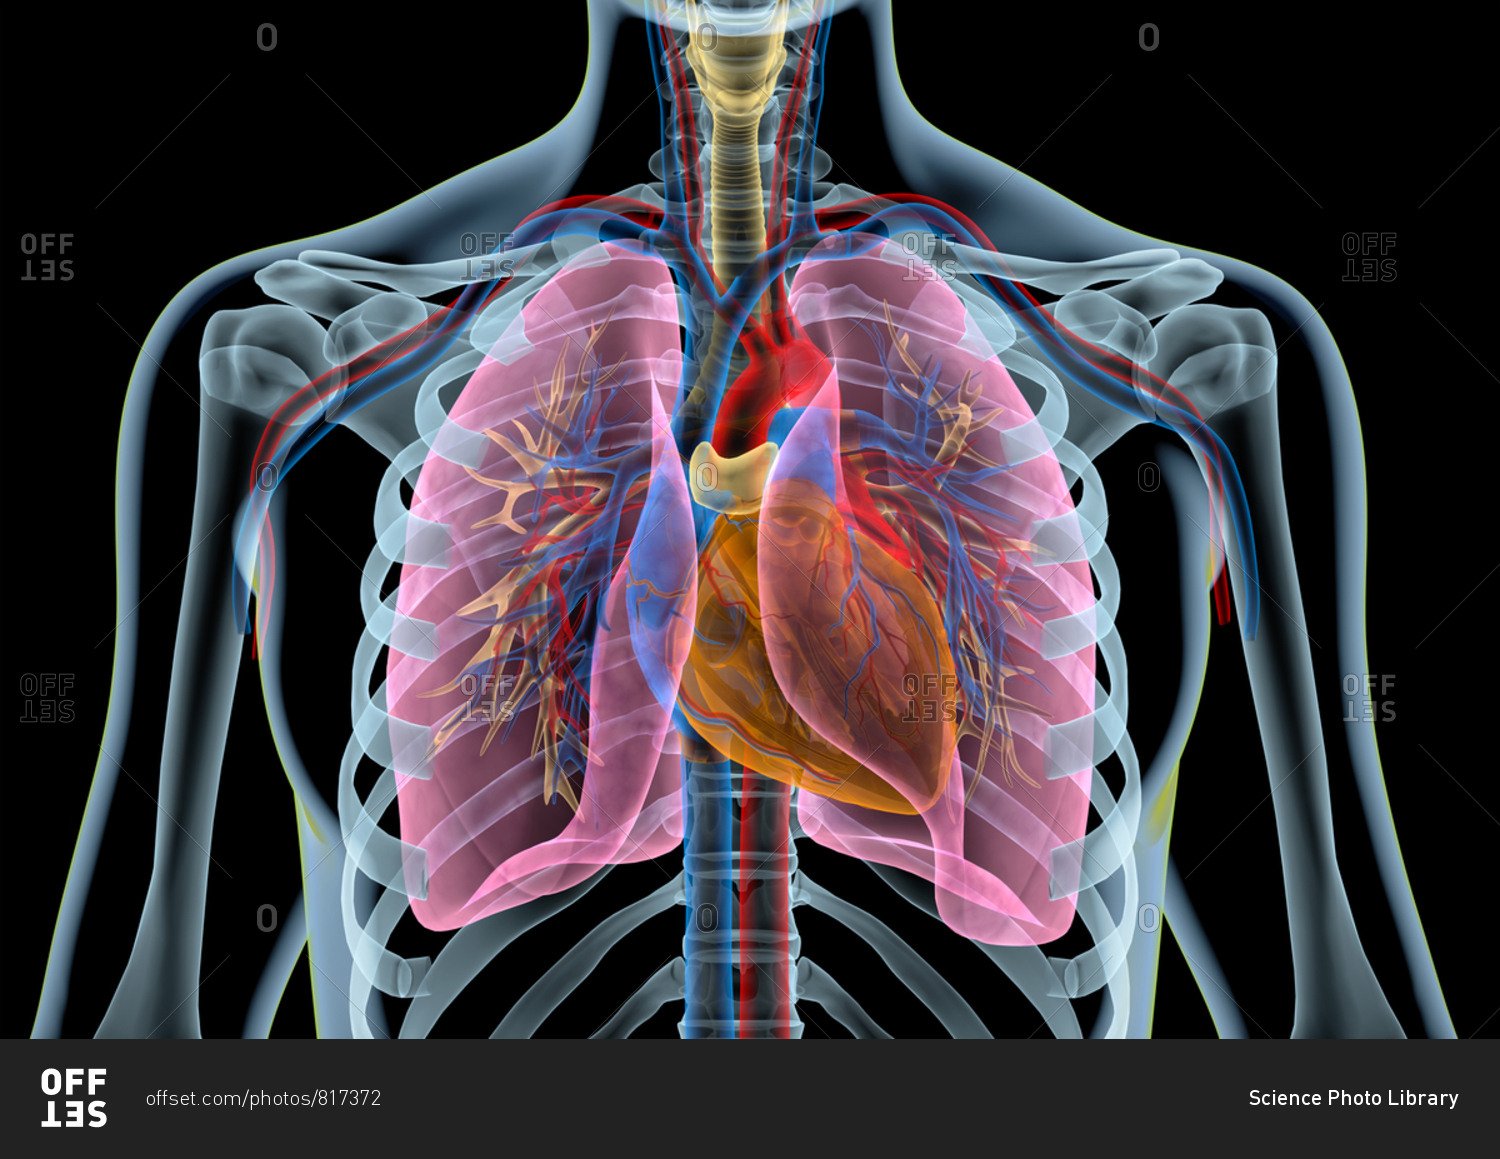
Right around the pandemic hit my mom developed a chronic cough that was eventually determined to be caused by the air pollution in Phoenix where she lives. This project would be an art piece. It’s comprised of a wired ribcage that will be “softened” with felt or fabric of some sort. Inside there will be paper bag “lungs” and acrylic “heart” which will beat in certain rhythms based on current air quality readings from an API. There might be a condition that could trigger the sculpture to “cough”. This project idea would be a combined final for my Connected Devices course.

Project proposal quad chart

Materials

I’ve already ordered a handful of materials that should arrive on Friday.

From Adafruit:

From Amazon:

My Experts

Kate Hartman was my professor for Textile Interfaces last semester and she’s an expert in wearable electronics. Kate isn’t available for a call this week but I asked her about her thoughts on fabricating the felt ribcage over email. She suggested I use armature wire for the ribcage: “You could create a sewn fabric or sheet felt rib cage, fill it with stuffing, and then insert the armature wire. You could even felt on top of the material while it is still flat before sewing the tube that makes up the rib.” She also sent me some other interesting resources I still have to check out.

I set up some fabrication office hours with Phil Caridi for this Wednesday after class. Maybe he has some more things about felting!

I also set up an office hour with Kari Love for Friday to chat about driving the air pumps and potentially fabrication.

I have also been in touch with Amitabh Shrivastava (@tinkrmind_, creator of Programmable Air) online so maybe I will get some helpful insights from him as well!

State of the Art

Lungs, Kit Paulson

Zebra Shipping Paper Airbags

The Inner Self Collection, Wei Ting Liang

Path Forward

  • Research felting and armature wire

  • Office hours with Phil

  • Get ribcage materials from Michaels

  • Try inflating a paper bag with the Programmable Air

To see the next blog post about this project click here.

Resources

https://americanart.si.edu/artwork/lungs-117714

https://www.signode.com/en-us/productslist/shippers-paper-airbags/

https://trendland.com/weiting-liang-collection/

[ITP: Connected Devices] Hue Controller

Concept

For my Phillips Hue controller I wanted to take a page out of Bianca’s book and use the Arduino Nano 33 IoT’s on-board IMU to control the light strip attributes. I had never used an accelerometer to determine orientation before. I also had this tiny six-sided candy tin sitting around my house and really wanted to use it as an enclosure for my light controller. As well as having one orientation turn on the light and another to turn it off, I wanted placing the tin on its different sides to change the hue of the light.

Arduino Code

First, I got used to using the Hue’s Debug Clip Interface. To use that interface you need to generate a unique username to connect to the Hue bridge, the IP address of the bridge, and the number of the light you want to control. The image on the right shows what that site looks like and how you can use API calls to get or send certain info to the Hue bridge and change the state of the light.

Once I felt comfortable using that tool I switched to working with the Arduino. I started with this example and got it working pretty easily, blinking the Hue strip using my Arduino. Next, I found this article about the Arduino’s accelerometer. The board has a LSM6DS3 module which includes both an accelerometer (linear acceleration) and gyroscope (angular velocity). It was super easy to get sensor readings using Arduino’s LSM6DS3 library.

Great! I did not know what these readings meant or what to do with them!

This may be review for the smarty-pants reading this but I eventually learned that the accelerometer data is showing the acceleration of gravity. So, if the Arduino+sensor is pointing straight up the measurement is +1 on the z-axis and if the Arduino is pointing straight down the measurement is -1 on the z-axis. This info helped me build out the different states of my code.

I wrote some really dumb code to control the light strip. Basically, if the z-axis reading is within a certain threshold, send a request to turn the light on or off.

The request follows the same syntax that was used in the web tool, so the “sendRequest()” function just pieces together the API call string and sends it over HTTP.

I used a whole bunch of other if-statements to check for different orientations of the controller tin and Arduino. Below is an image of my thought-process while working out the accelerometer math and a video of the Arduino updating the strip light on the floor based on the sensor readings.

Fabrication Process

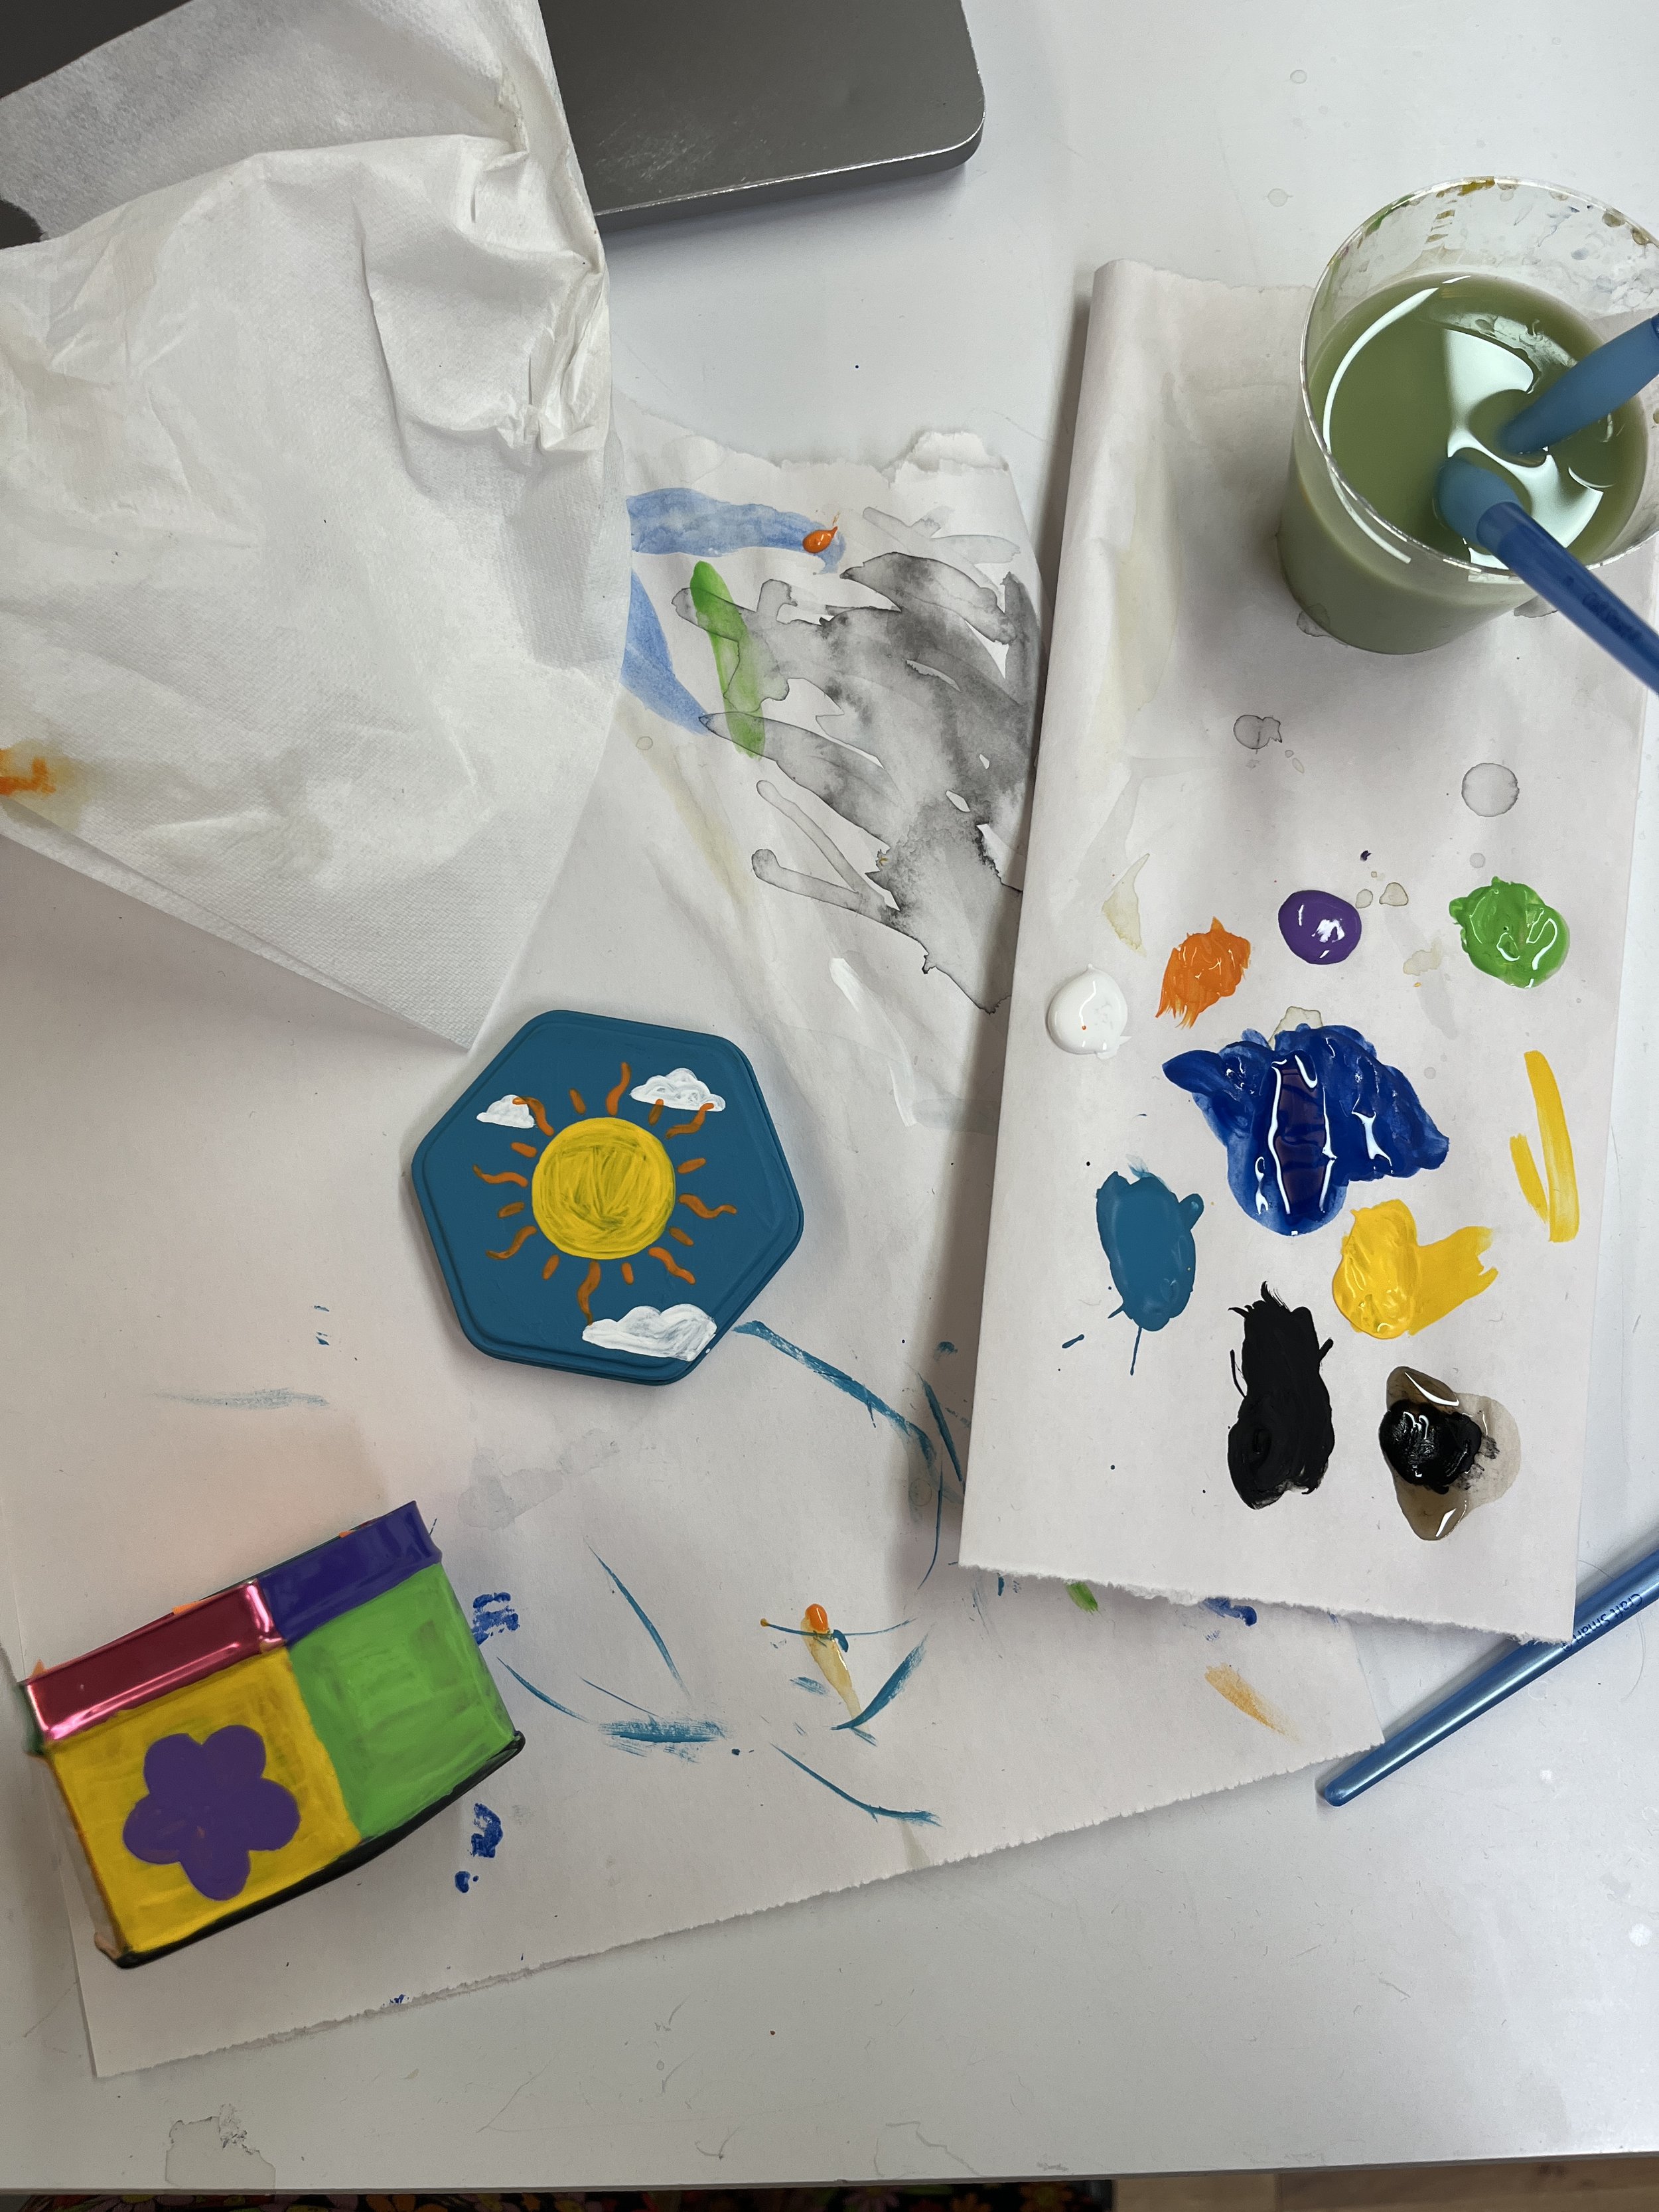
Working with this tin proved to be really difficult. It is really small so it was hard to fit the Arduino and battery inside. I soldered a custom connector to get the circuit to be as minimal as possible. It was also a real pain to paint the smooth surface of the tin. Or maybe I have some really cheap paints … which I do. I had this plan for a really illustrative and cute enclosure for my controller, but I did not quite get all the way there. I also never figured out how to mount the Arduino within the tin to keep it straight and from moving.

Final Product

Ok! This did not work! At all! I basically built a faraday cage, what was I thinking?!

Once I tried testing my controller inside of its enclosure it wasn’t working like it was before. I guess I thought this tin would work as an enclosure because I used one for my networked controller. I might be able to get this enclosure to work if I cut an opening on one of the sides of the tin or somehow use the enclosure as the antenna itself, but I have no idea how to do that.

Final Project

I’ve thought of a final project idea that I think could satisfy this final and my final for my soft robotics class. I’ve outlined my initial idea and sketch on the second half of this blog post and some of the preliminary steps to get started.

Resources

https://tigoe.github.io/hue-control/

https://github.com/tigoe/hue-control

https://biancagan.com/2023/03/06/wk-6-more-dashboard-fun/

https://www.youtube.com/watch?v=wN1tGdNkUXY

https://github.com/makin-stuff/ITP/tree/main/Connected_Devices/Hue_Control

[ITP: Connected Devices] Neighbors Amor - Collected Data Reflection

Here’s a link to my previous documentation of this project.

OK, but what does the data mean?

In Tom’s conndev class we finished up with making our environmental sensing devices at the midterm and set them up to collect data over spring break. I worked with Gracy to make Neighbors Amor and my house sensed the RGB values of ambient light and sent them to my personal server and web page using the MQTT protocol. Tom also ran a server that listened to the whole class’s MQTT topics and logged our data to a ginormous file. My data file contained 55000+ data points of RGB values!!!

To try to process my data in line-graph form doesn’t make much sense for RGB values, so I wanted to recreate my original dashboard but LARGE scale. I used p5js to make this visualization. First, I loaded my csv data table. Then I created a grid of 100 x 100 rectangles, that’s 10,000 data points total. Through printing some table values to the console, I could figure out what rows/columns corresponded to the RGB values of certain days/times. My device sent data every 15 seconds, but for this reflection I used every 4th reading, that’s one a minute, so that I could look at a greater span of time in one image. This image is comprised of data spanning the last 40,000 points in my data table. You can see my full code here.

The top 1/4 of the square reflects NY data and the rest is from AZ. The sensor read pure black (0, 0, 0) at night and pure white (255, 255, 255) in direct sunlight. One thing that is important to remember is that this data isn’t continuous. Within this time the device got disconnected from the broker, I traveled to Phoenix, and just the general tech weirdness. There are definitely some anomalies in the data… like what is that pure red line going through the middle? A solar flare?! And it’s kind of hard for me to describe the green and brown moments. What I think is cool to see in the top section there’s light pink that appears within a black time frame and that is when a roommate in my apartment turned on the pink-hued light in the living room during the night. Transitions between gray and white is when the sensor saw a lot of cloud movement. But there are definitely some squares (like the yellow and bright green) that I can’t explain.

Starting to control the Hue

  1. Create a Hue developer account

  2. Create a unique username to connect to the Hue bridge using the tool Tom created

For the time being I just want to mess with the strip light set up on the floor and Tom already told us that it’s light 3 on that hub. By knowing the IP address of the hue bridge we want to talk to we can send it commands directly from the Debug Clip Interface. I was able to change the light’s state, brightness, and color from a browser window.

Resources

https://p5js.org/reference/#/p5/loadTable

https://itp.nyu.edu/classes/light/resources/philips-hue-control/

https://tigoe.github.io/hue-control/

[ITP: Connected Devices] Environmental Systems Monitoring Device - Buddy Devices

Group member: Gracy Welihan

This is a continuation of my device data dashboard project. My previous blog post can be found here.

Planning

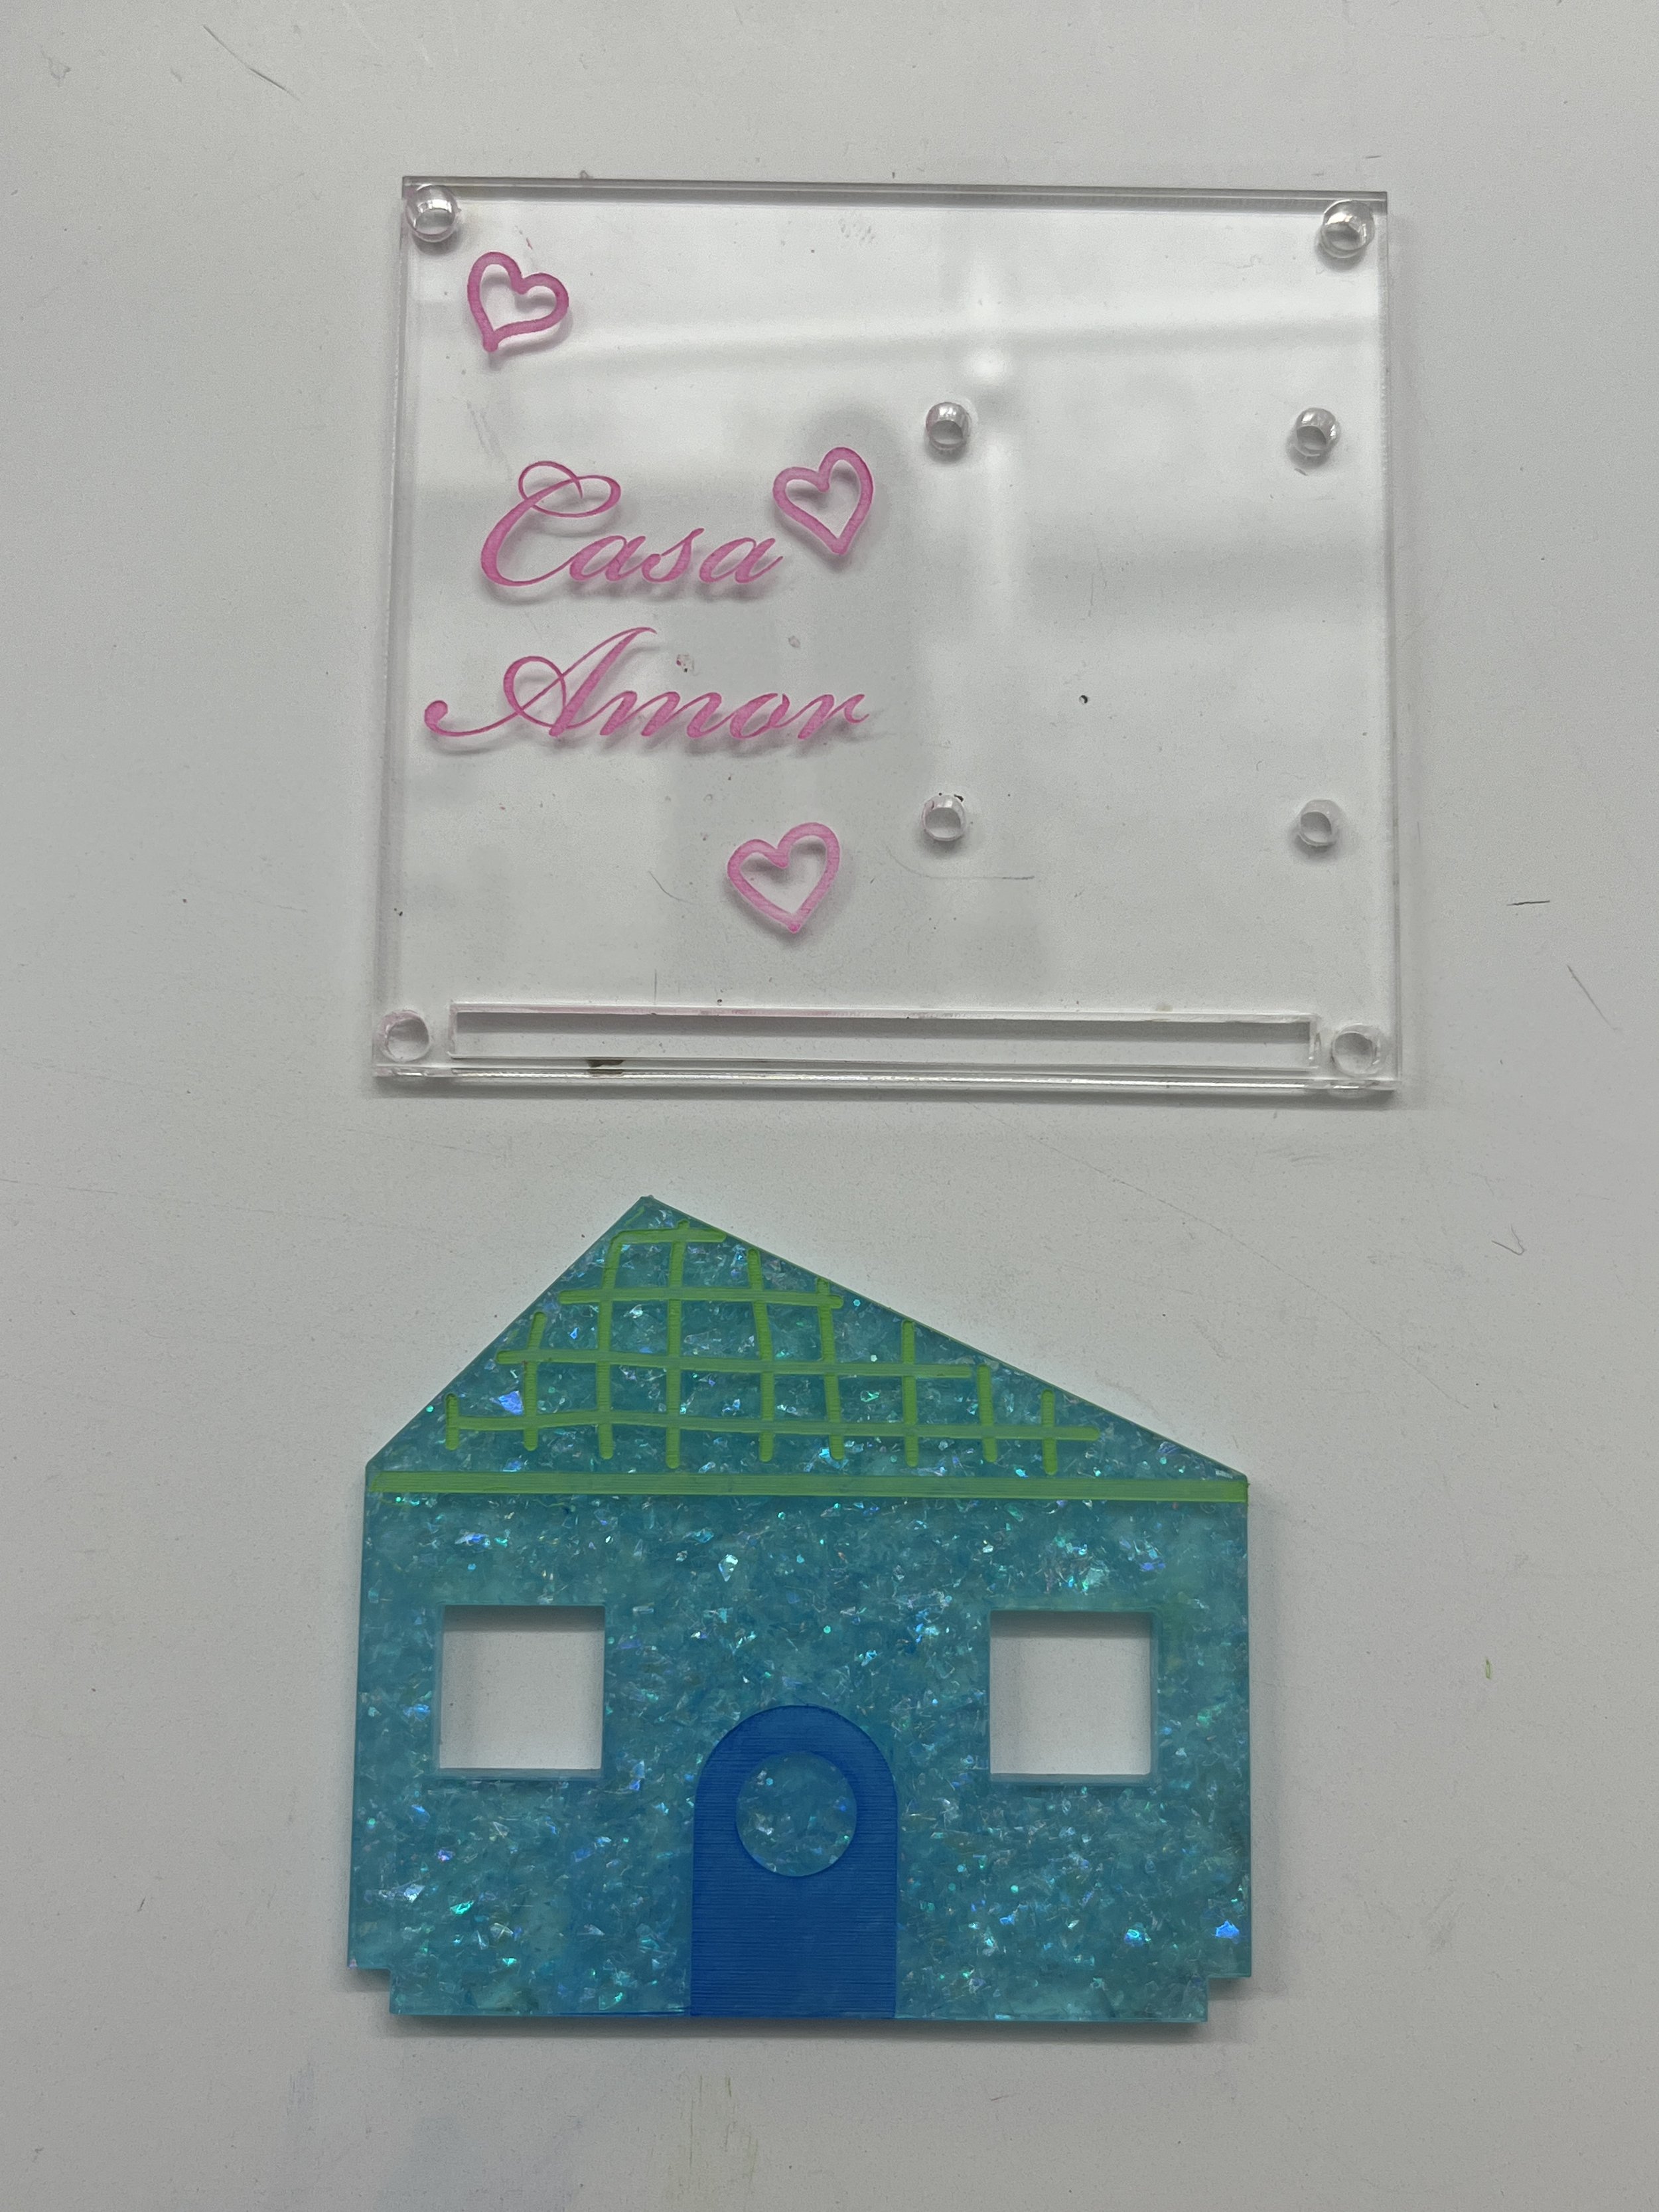
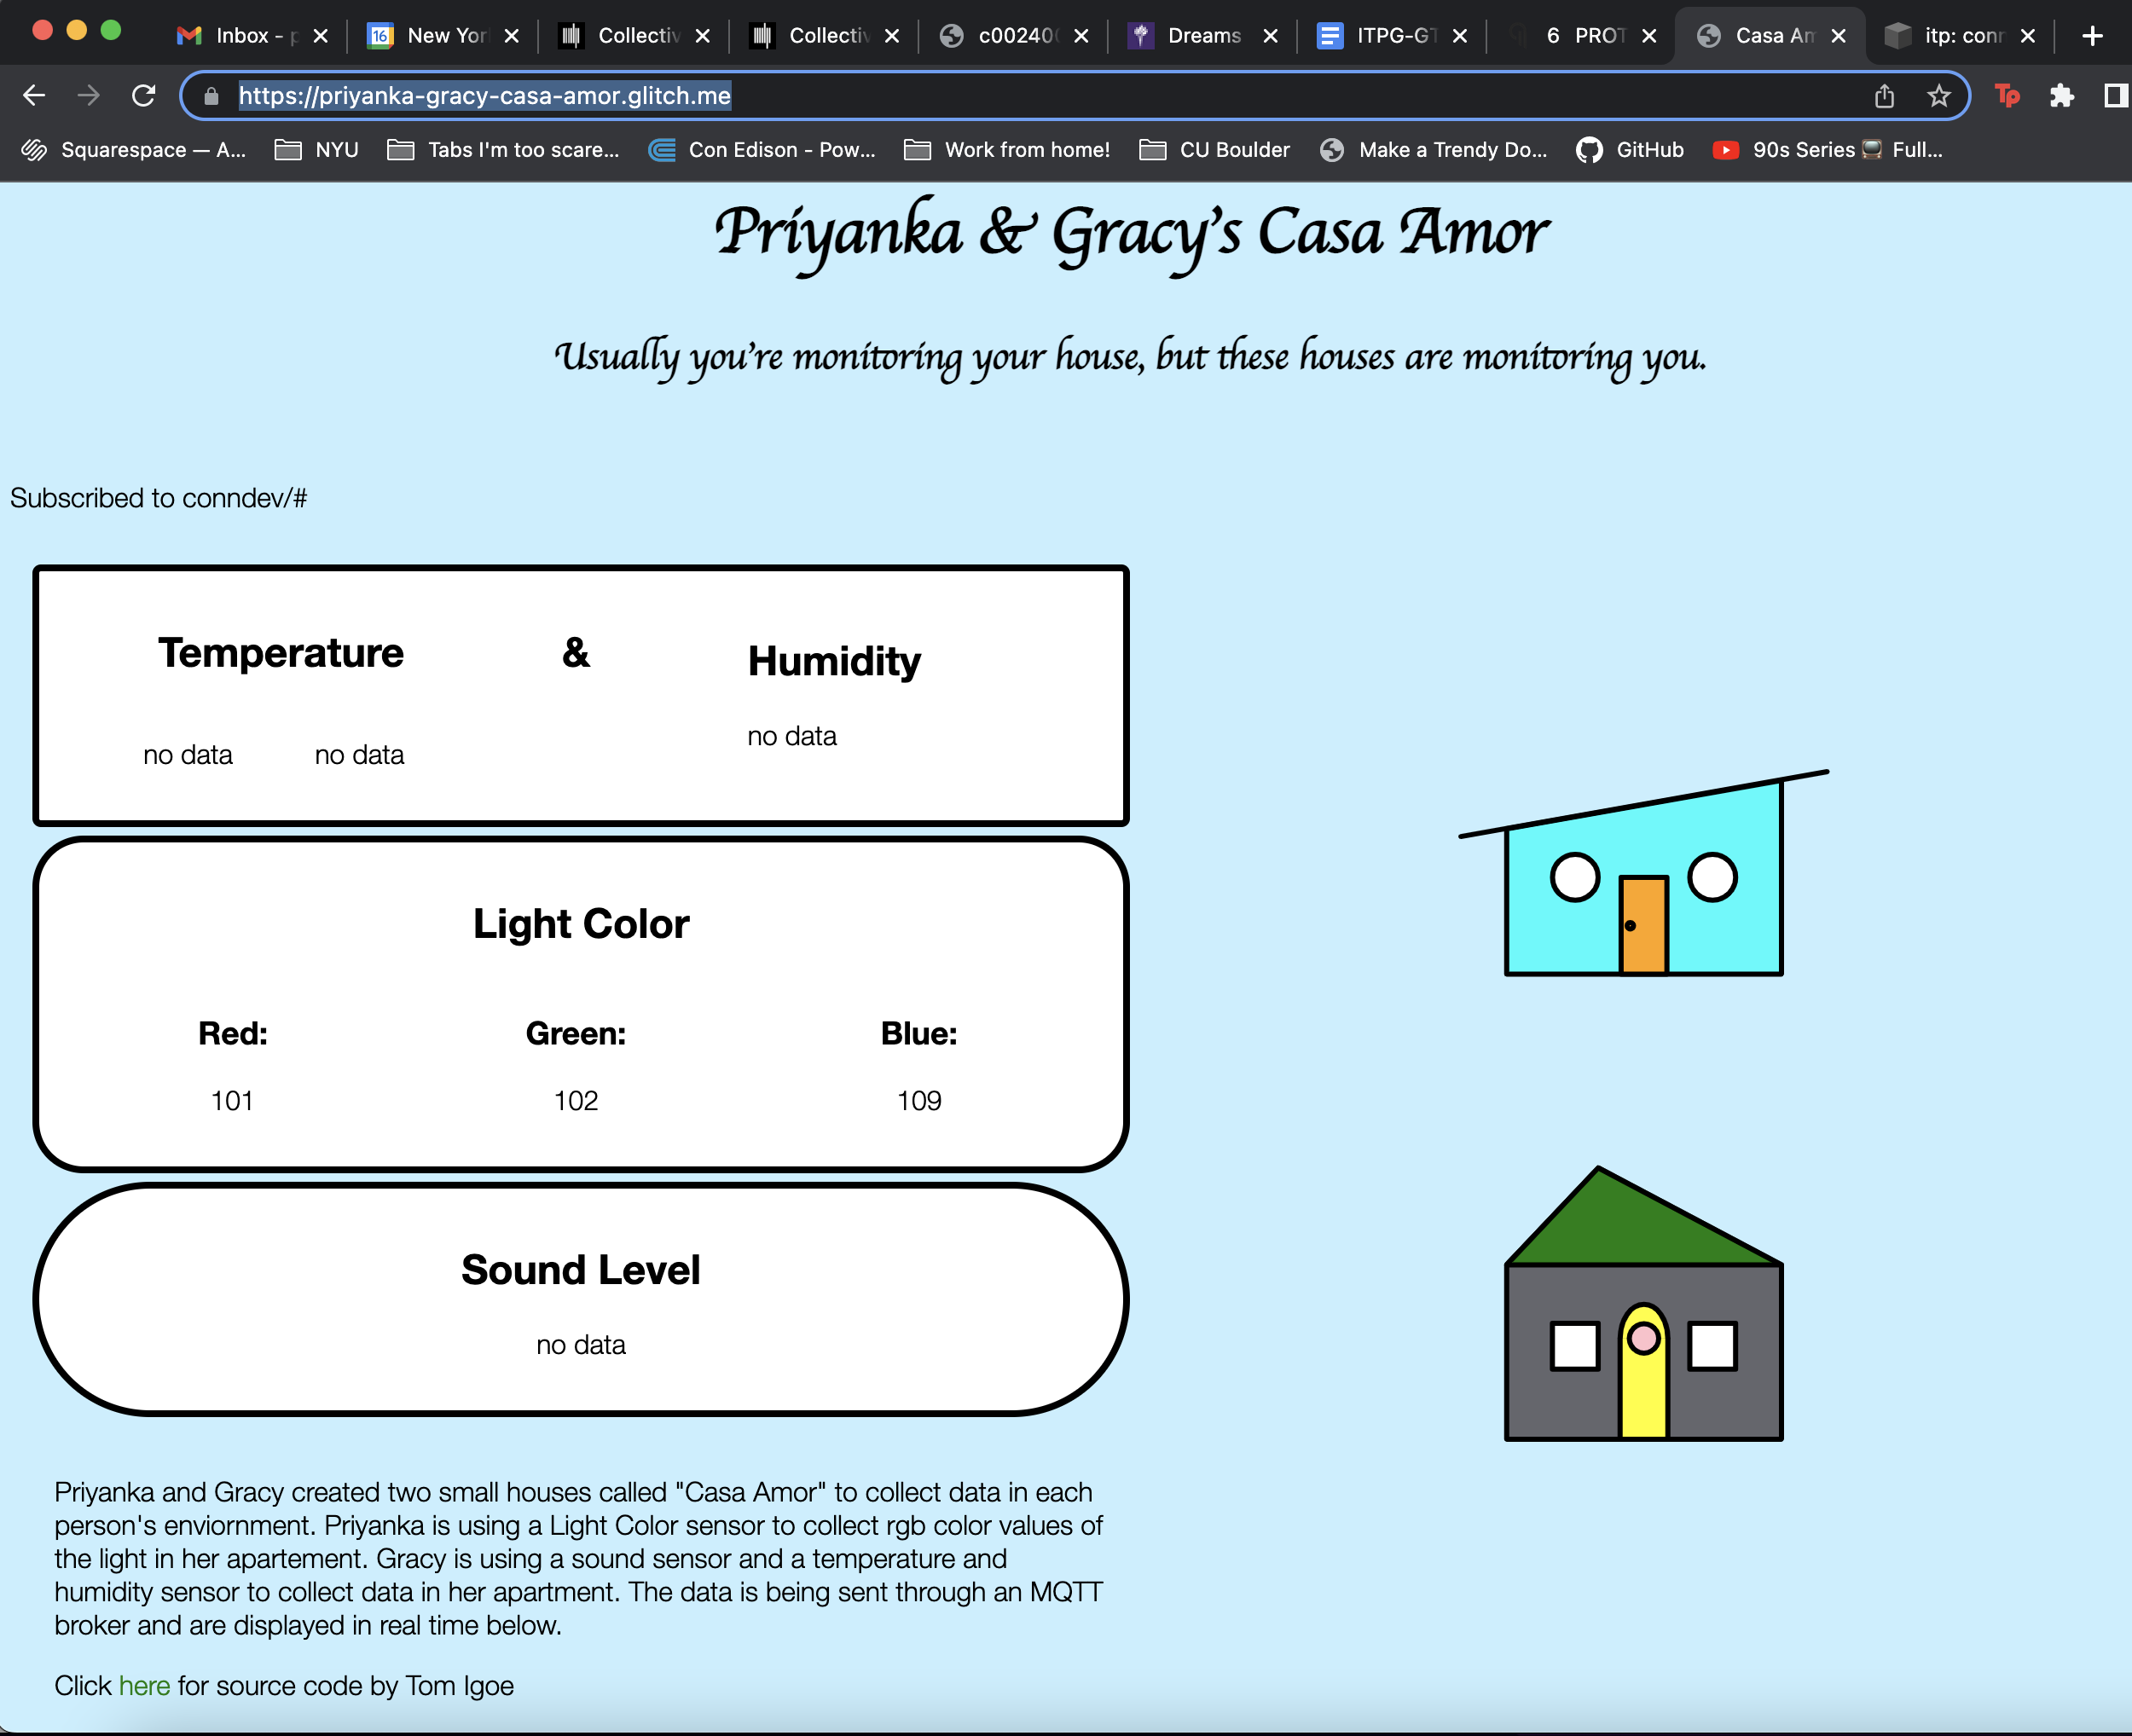
Below are some initial sketches I came up with when thinking about our environmental monitoring devices. We went through a lot of brainstorming. Gracy’s sensor measures temperature and humidity and my sensor measures light and RGB values, everybody’s favorite TCS34275. I always love some sort of gimmick when it comes to making projects, so I thought it could be fun to make the enclosures fun shapes… because you can make any shape with the laser cutter! But then Gracy mentioned making a house and I really liked that idea. Normally with IoT we are monitoring our house but in this case the house is monitoring us!

I also knew I wanted to use a screen in some way because I had never done that before. I got an E-Ink display and a regular OLED from Adafruit but utlimately decided to go with the OLED because the E-Ink is really advanced and has too many pins. I’ll have to save that for some other project.

Protoboard

Since we had already working devices and basic dashboards, I got started with getting the screen running. Adafruit’s monochrome OLED defaults to I2C communication, which is the same as my sensor. This should work in theory, especially since the two devices have different addresses, but as I would plug my sensor in the graphics on the screen would freeze. I cut the two jumpers on the back to put the screen into SPI mode and the system worked much better.

I used Adafruit’s GFX and SSD1306 libraries to get started with the screen. I also uploaded my new Arduino code, with the OLED additions, to Github.

Then I transferred my circuit to something a bit more permanent and soldered together this proto board. A little bit of tacky putty can be your best friend!

Gracy’s circuit consists of an SHT temperature and humidity sensor on the I2C bus and a KY-038 sound sensor on analog pin A0. Here’s that all soldered together.

Fabrication

Here are two things that are true:

  1. I’m in love with the laser cutter.

  2. We went crazy with the house idea.

Our enclosure needed at least one outward facing wall to get the house idea across. I remembered this slot-ing technique we had learned in intro to fab during enclosure week and that really worked like a charm with our cardboard prototype. I also tested out this technique of painting over the acrylic. After wiping the excess paint off with a rag, the color remains on the etched part of the material. Yay, multicolored house!

Assembly was a little bit tricky because sourcing the right mechanical hardware is always a challenge for me. For one, I had three different sized holes in my design that all needed the correct screw size (…some metric, some imperial). We also needed larger standoffs than were available in the shop but we eventually figured out a solution by mix and matching different spacers. I was also tipped off by Phil to use some hot glue as stand offs/attachment for the proto boards.

My laser cutter files are also on Github for anyone following along.

Final Product

Dashboard

My very simplistic, original dashboard is still live on my private server. But Gracy created a super cool and cutting edge online dashboard that displays all the data from our various sensors and both houses! You can find it here. Looks like Gracy’s house isn’t live at the moment.

[ITP: Connected Devices] Device Data Dashboard IV

This is a continuation of my device data dashboard, see my previous blog post here.

Getting the Ball Rolling Again

I tried getting my sensor set up sending MQTT data at home and got my local webpage running and I got an error I hadn’t seen before running Tom’s mqtt.js example: “mqtt.js test.mosquitto.org failed: The certificate for this server is invalid”. I remembered that I wasn’t able to get my Arduino to connect to the broker with a “WiFiSSLClient” so I changed that to just “WiFiClient” in my Arduino sketch. I changed this in my script.js file to use the unencrypted port 8080:

I also needed to get reasonable RGB values from my sensor because the getRaw() function returned some 16-bit value read straight from the TCS34725’s registers. I looked through the Adafruit Arduino library and its getRGB() function returns the RGB values normalized to 0-255, exactly right for web colors.

Dashboard Construction

So I thought about it and the reason this dashboard is so important to me is because I find myself stuck indoors too much (almost all the time) and I could run this webpage in the background to check the color of the sky during the day. I placed my Arduino + sensor on a window sill in my apartment that gets direct sunlight during the day. Fingers crossed the roommates don’t mess with it!

I modified Tom’s code by removing the stuff that wasn’t necessary to my dashboard; at this point I do not need to publish to the broker. I am super rusty with web stuff so my first goal was to change the background of the webpage to match the RGB sensor value. Then I referenced the amazing Bianca Gan’s “Thesis Clock” code to see how she drew different shapes with JavaScript. I used the html canvas element to draw rectangles with the RGB values from my sensor.

Since this dashboard will be acting as a kind of clock, I want to track the changes in sunlight over the course of a day. We know that the MQTT broker doesn’t hold on to any data over time so it is up to the JavaScript client to hold on to relevant data. I created three arrays to hold on to past RGB values. I made the array 100 elements long because of the following rationale: check sensor every 15 mins * 24 hours a day = 96 data points —> make it a perfect square of 100. If the array fills up, the script replaces the oldest data point with the newest one. Thanks Tom!

Next I wrote the logic to draw the grid of squares and loop through the RGB data to assign the fill colors. I started small with a grid of 9. I also made a dummy array to test the fill of the grid. Looks like the logic is correct!

Here’s what the dashboard looks like working to scale and with the sensor data. The newest data reading is always in the top left and the oldest is the last rectangle. I did some minimal CSS to get the dashboard looking better. I also got a timestamp for the last data point using the Date() object in JavaScript.

The pink is when someone turns on the living room light in my apartment!

Sunny day

Cloudy day

For the time being, my code lives here if anyone is interested in peeking.

Going Live

  1. Put all web files into “public” folder

  2. Write the server.js and package.json files. I stole this server code from Bianca.

  3. ssh into digital ocean server in computer terminal.

  4. I already had my ITP repo cloned to my droplet, navigate into it and “sudo git pull [url]”.

  5. Follow this tutorial like we’ve done in the past to use PM2 to run the server and set up Nginx as a reverse proxy.

IT’S ALIVE! I’m amazing!

Questions

Why?

Why can’t I get my system working with SSL?

Using test.mosquitto, I had issues connecting to the broker on the web page side. I switched over to shiftr.io and I didn’t have those problems anymore. Why is that?!

Here’s a link to my next blog post about this project.

Resources

❤️ https://github.com/biancaagan/QuestionableThesisClock ❤️

https://github.com/tigoe/mqtt-examples/blob/main/browser-clients/mqttjs/MqttJsClientSimple/script.js

https://www.w3schools.com/graphics/canvas_drawing.asp

https://developer.mozilla.org/en-US/docs/Web/API/Canvas_API/Tutorial

https://www.w3schools.com/js/js_arrays.asp

https://stackoverflow.com/questions/33745249/js-how-do-i-create-a-10x10-grid-of-filled-rectangles

https://javascript.info/date

https://www.digitalocean.com/community/tutorials/how-to-set-up-a-node-js-application-for-production-on-ubuntu-20-04

[ITP: Connected Devices] Device Data Dashboard III

In my last blog post I got my sensor logging data using the TCP-to-net-cat connection. As a review, I’m going to get my sensor logging over a broker connection using MQTT, but I’ve done this before.

MQTT data logging

Recall that “Message Queueing Telemetry Transfer, or MQTT, is a lightweight IP-based messaging protocol designed for communication between sensors, controllers, and other devices. It’s designed to support equipment that may not always be online, like automated devices built with microcontrollers,” as Tom put it so well.

Using the ArduinoMqttClient library, start with Tom’s ArduinoMqttClient.ino. For some reason I was unable to connect to the broker with the “WiFiSSLClient” in line 33, but changing it to “WiFiClient” worked for me. I also setup the broker settings (test.mosquitto.org, port = 1883, topic and clientID). Next I added in all my sensor stuff (TCS34725). I got it working! I’m using MQTT Explorer and am subscribed to the “conndev/#” topic under the "Advanced” settings; looks like I’m the only one here right now.

Side quest: Turning an LED on/off with MQTT

Drumrooooollllll… I’ve been dying to learn how to do this for some personal projects of mine so I’m excited we went over this example in class. I’ve modified the MqttClientSubTopics example to just manipulate the LED. I removed the sensor stuff and added control of the built in LED on my Arduino. Here’s a video of me updating variables using the MQTT Explorer software.

Web Dashboard

Ok, back to the Arduino example with sensor data. Now that my TCS34725 sensor is successfully sending the sensors RGB values to the MQTT broker, I shifted my focus to Tom’s MqttJsClientSimple example. I think I was able to get this to work?! I change the topic to “conndev/makin-stuff” and occasionally the RGB values flashed on the web page. I think they’re only showing up in the instant that they’re published?

Looks like the RGB values are 16-bit, so I remapped them to the range 0-255 for web colors. I don’t know how to internet!

If you’re following along in this project, see my next blog post here.

Resources

https://tigoe.github.io/mqtt-examples/

https://vimeo.com/375315679

[ITP: Connected Devices] Device Data Dashboard Part II

Setup Sensor

So to start where I left off last week, I need to use an actual sensor. To get myself started, I pulled out the TCS34725 RGB sensor I used in Understanding Networks last semester. It communicates over I2C, so I connected the sensor to my Arduino Nano as follows:

Arduino Nano 33 IoT

  • 5V

  • GND

  • SDA

  • SCL

TCS34725

  • VIN

  • GND

  • SDA

  • SCL

Once the sensor was connected correctly I ran the “tcs34725.ino” example from Adafruit’s library to double-check my circuit. Looks like it works! Also, I noticed as I was getting this sensor setup that this product has been discontinued by Adafruit, so I might consider using a different sensor for this or future projects.

Integrate with TCP Client Example

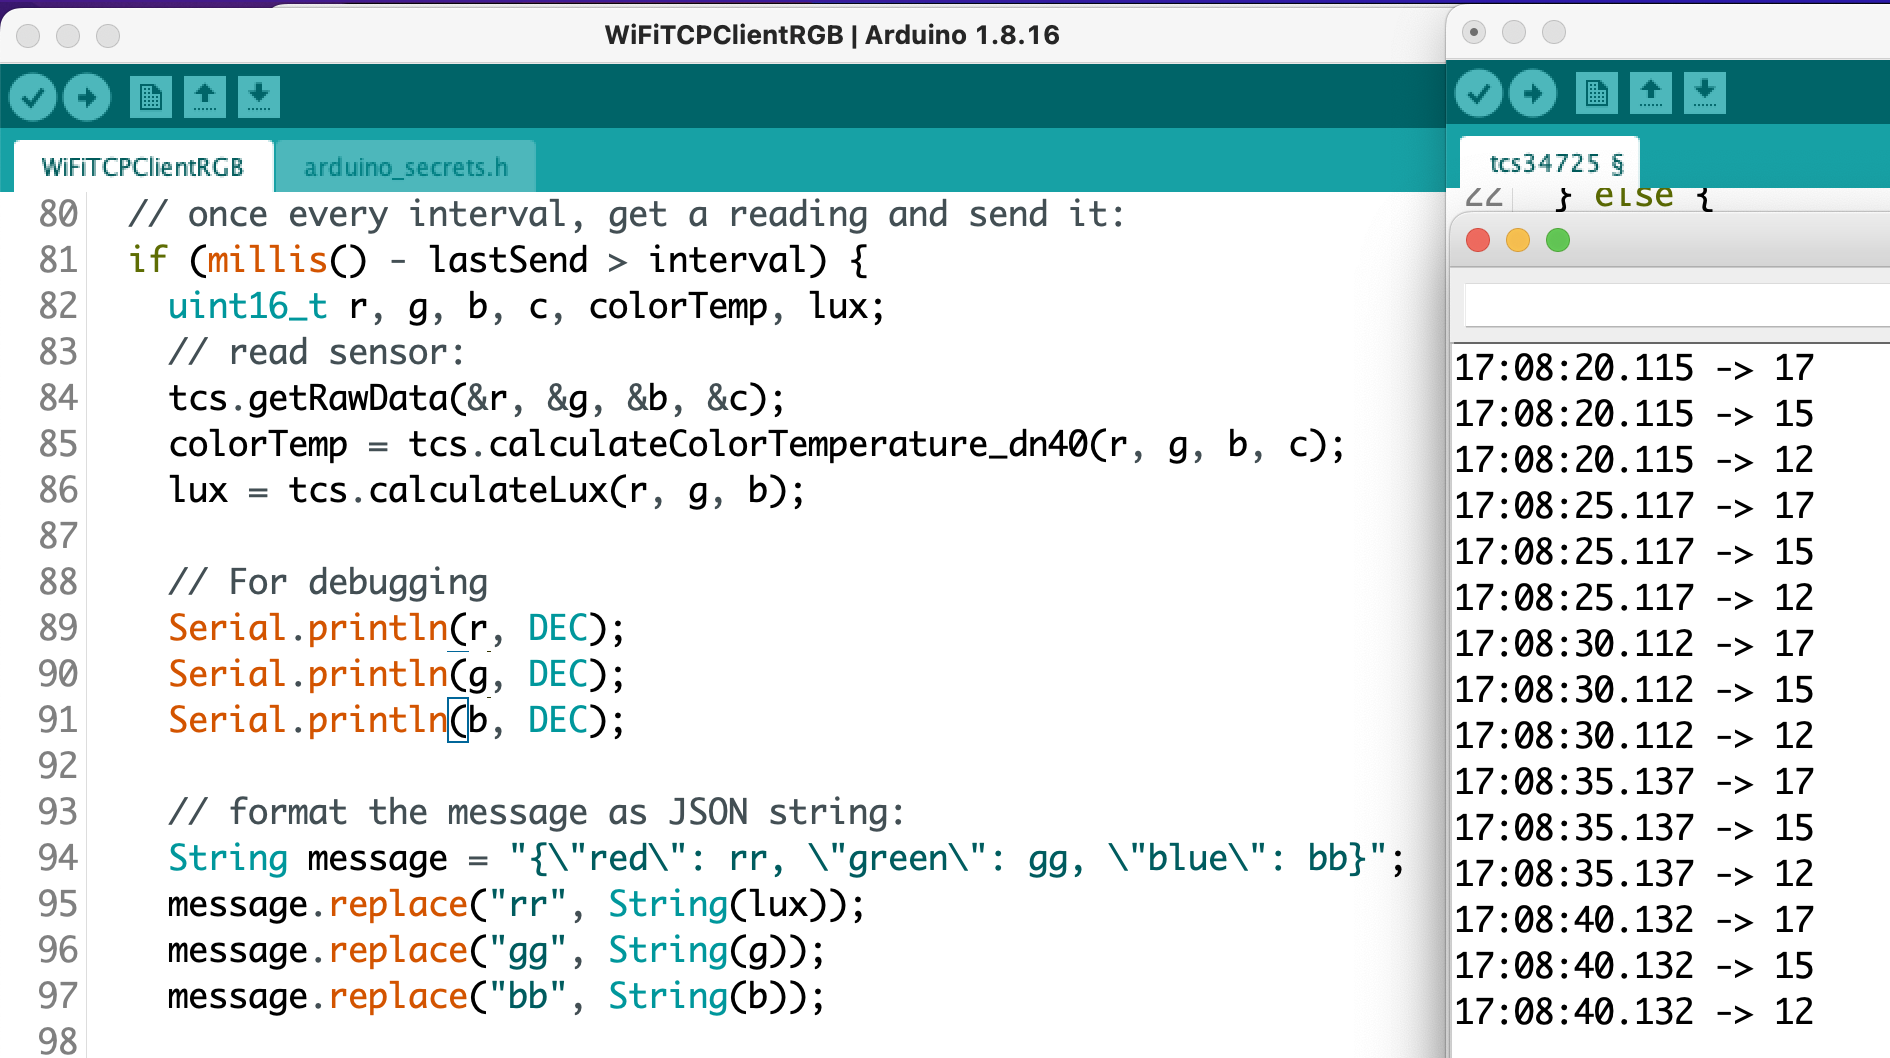
Port the “tcs34725.ino” example to Tom’s “WiFiTCPClientLogger.ino” example from last week. I was able to get my sensor readings to send over the sandbox370 network and they were received by netcat application listening on port 8080. But what is super weird is that the RGB readings are totally wrong, like nowhere close to the data I saw running the library example. At first I thought the issue may be caused by concatenating the message or the replace() function but below is my debugging, and even the raw data from the library is wonky. I’ll have to come back to this tomorrow.

Ok, I looked at this the day after running into this bug and turns out if you want the sensor output to look the same between different sketches you need to remember to initialize it with the same parameters (🤦‍♀️). This output looks a lot better!

Get sensor data onto web page

Now I needed to save my sensor data to a .json file. I followed the tutorial and ran “nc -l 8080 | tee log.json” in my terminal window. I could see something was happening because using the “tee” command I could see the sensor data on the terminal itself. But where is my log.json file? I looked at a couple of other people’s blog posts and found that my file is here:

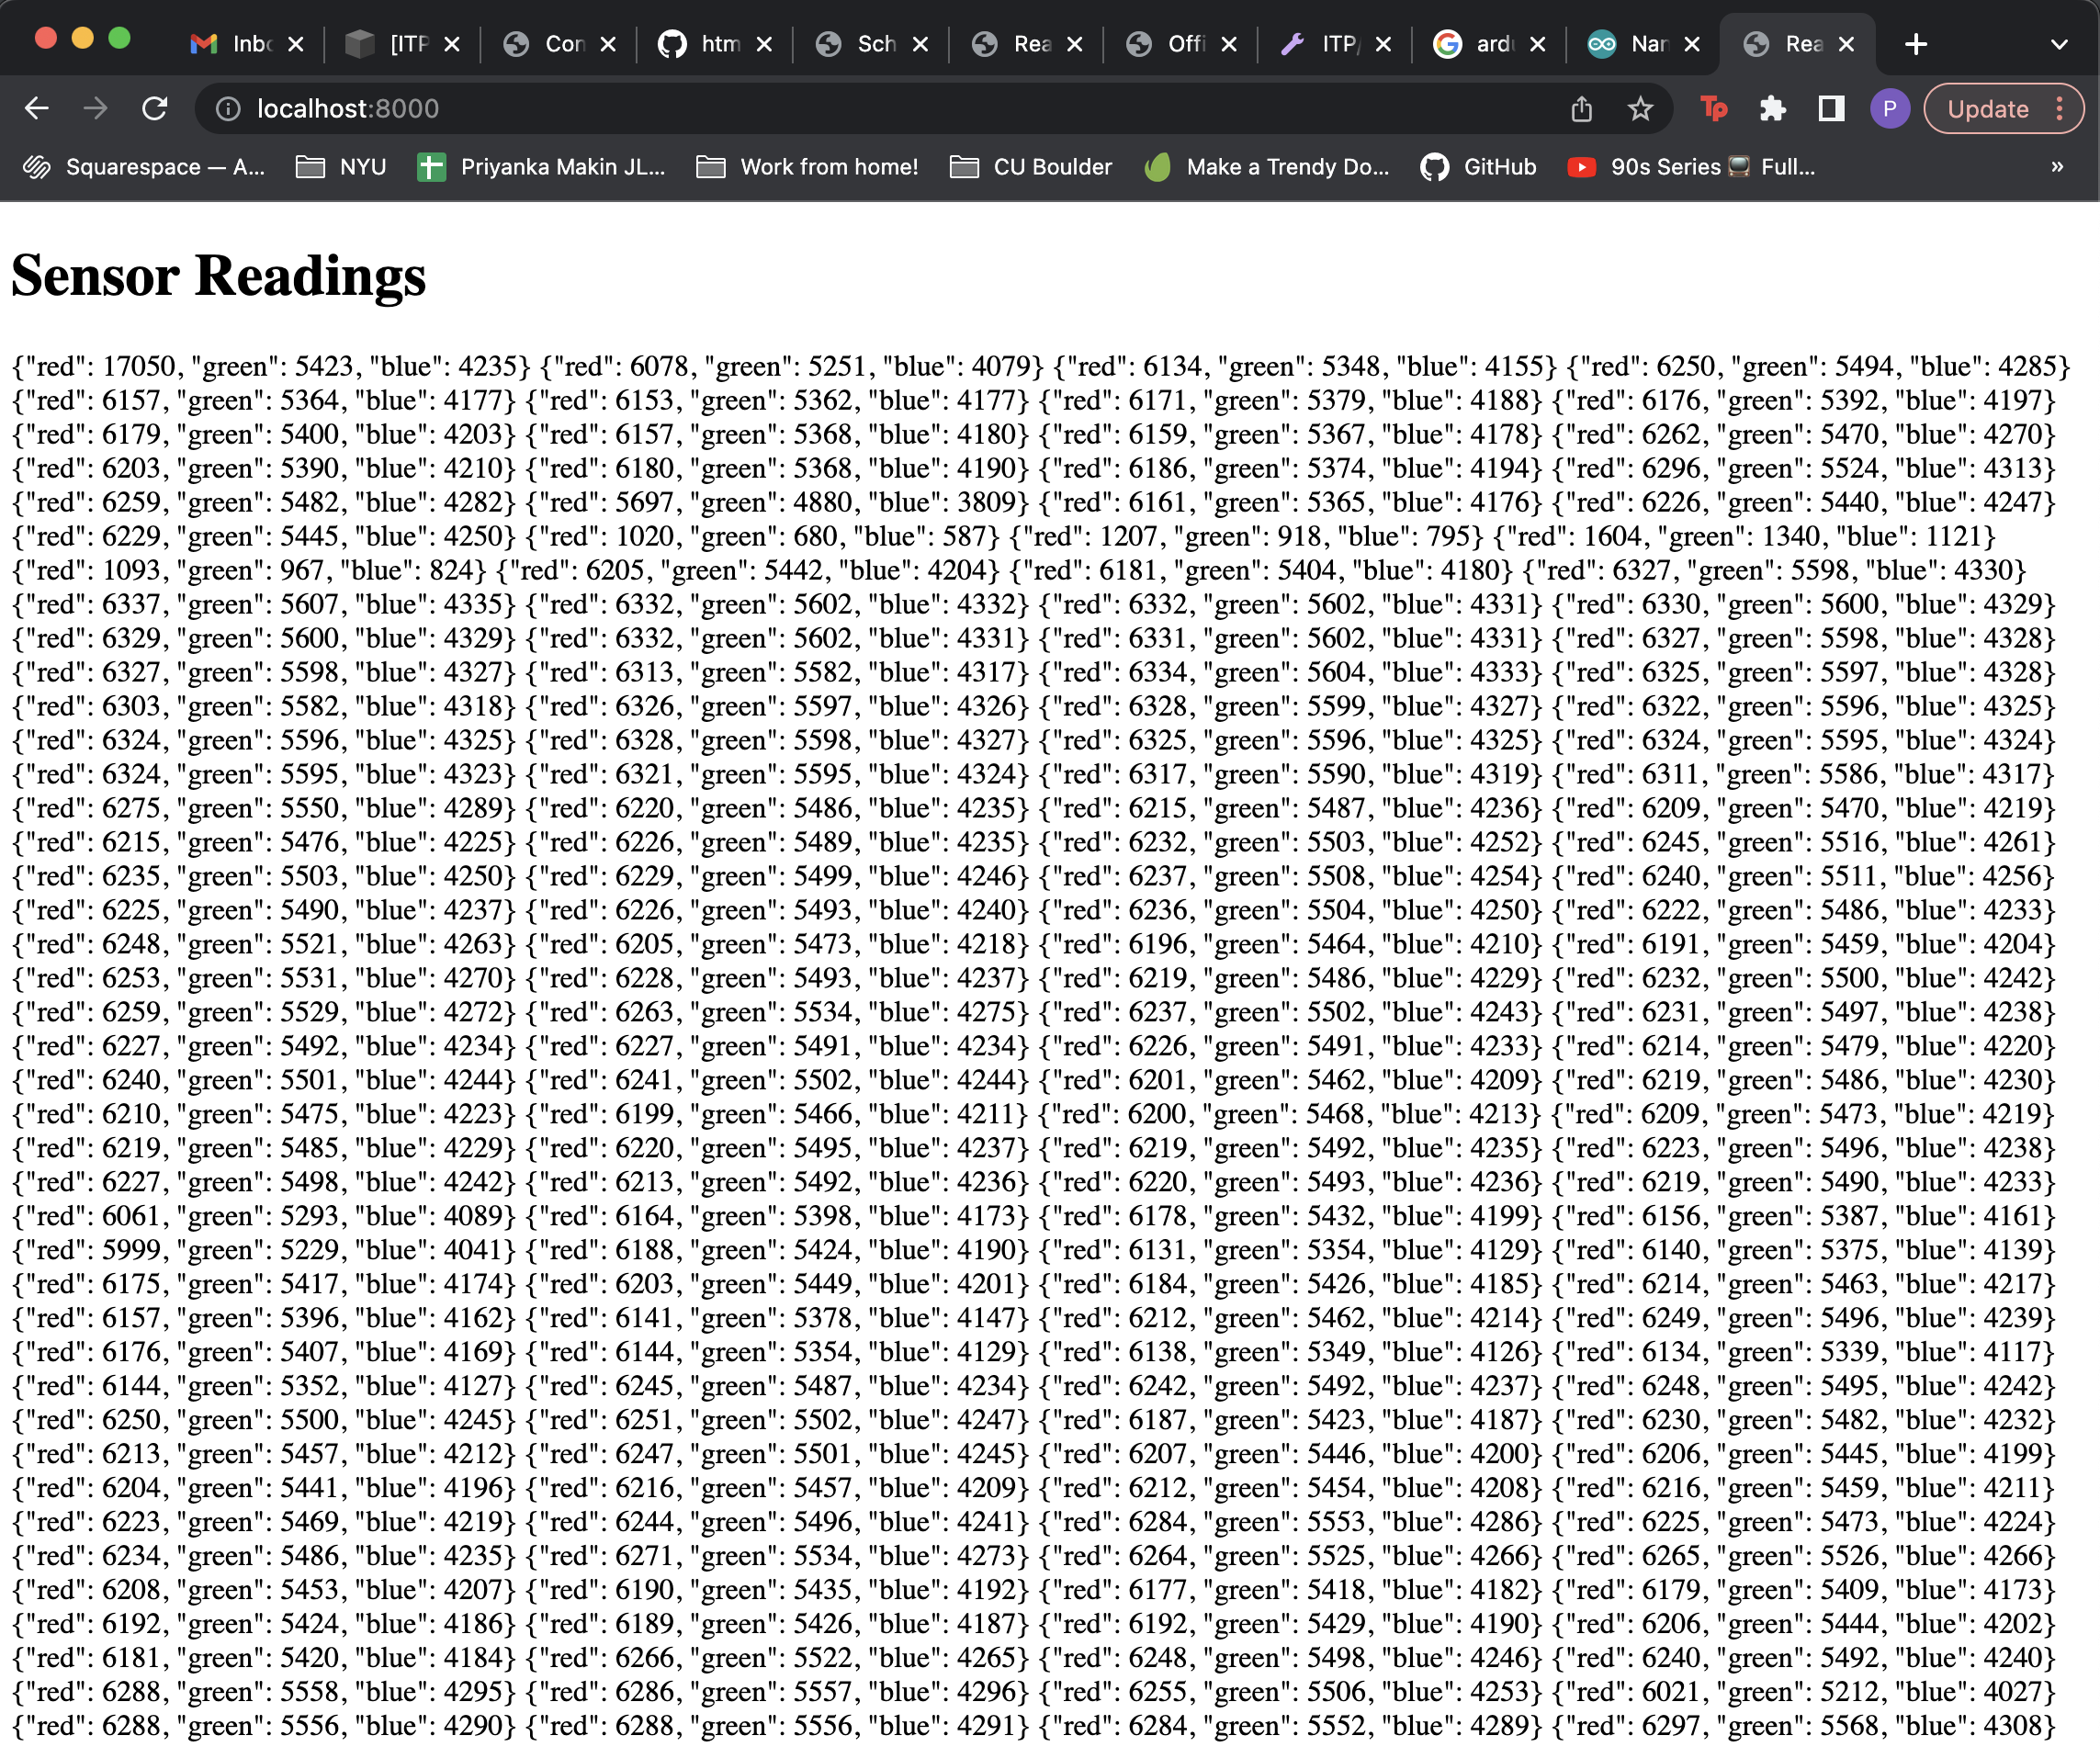
Which totally makes sense because in the terminal we are working in my user’s root directory. I followed the tutorial’s directions to run the sketch, navigate to the sketch directory (with index.html, script.js) and using Fetch to read the file. Typing “nc -l 8080 >> log.json & python3 -m http.server” in the terminal starts the server and then you can see the data coming in!

For a continuation of this project, please see my next blog post.

Resources

https://tigoe.github.io/html-for-conndev/DeviceDataDashboard/

[ITP: Connected Devices] Device Data Dashboard, TCP Socket

Process

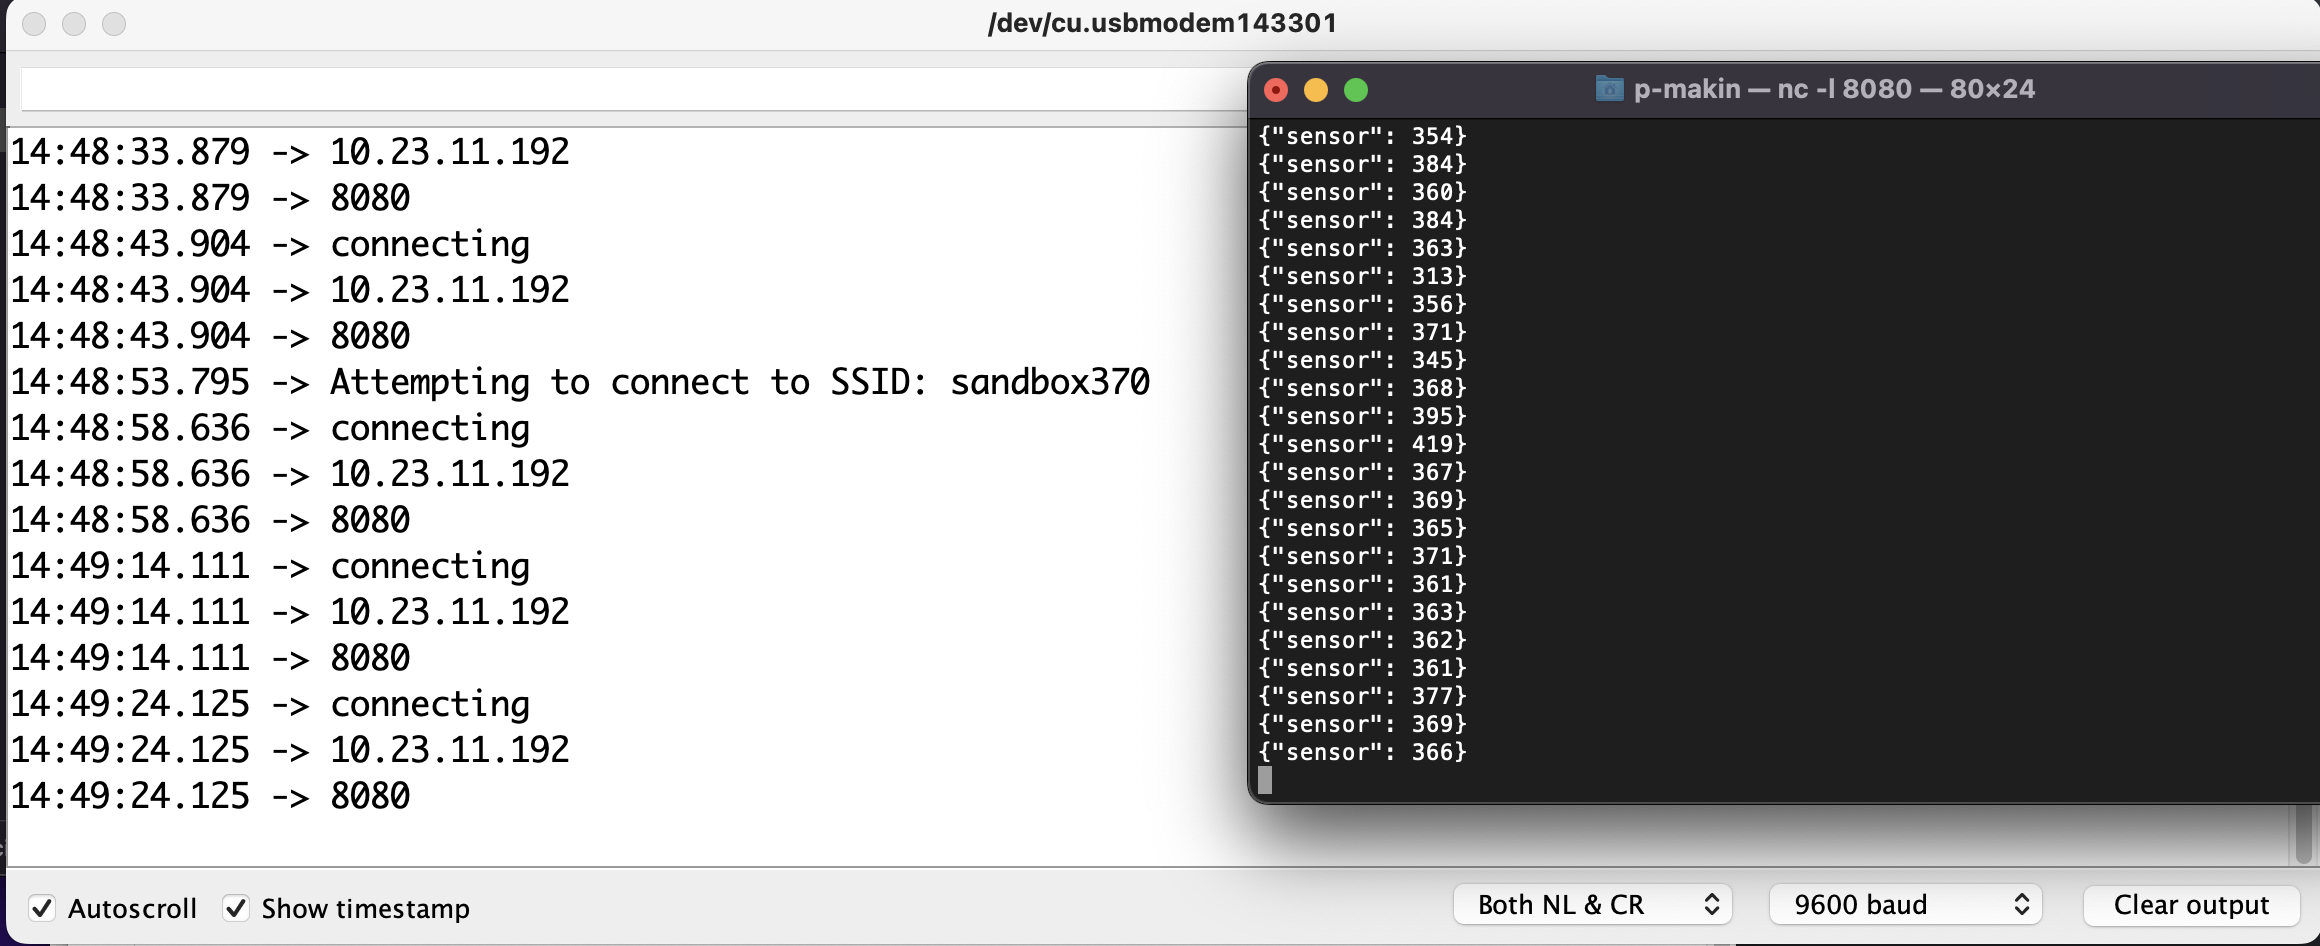
I did a bit of work to get kinda started on the device data dashboard assignment. My goal was to create a TCP socket connection between my Arduino Nano 33 IoT NINA module and my computer’s terminal. I first started with Tom’s WiFiTCPClientLogger example. Making sure my computer was on NYU’s experimental network, sandbox370, I updated the sketch with my computer’s IP address. I also added the “arduino_secrets.h” file with the network credentials to the example’s directory. Then, in my terminal I typed “nc -l 8080” and I could see my “sensor” readings coming over port 8080. Success!

Next Steps

The next thing to do would obviously be to connect my Arduino to an actual sensor so that I can track some real data. I’ve got a TCS34725 RGB sensor that I used last semester that I could work with. I’ve also got a weird spy camera from Adafruit, I wonder if I can create any interesting projects with that.

After getting some real sensor data, I think I need to port it to a .json file and create a webpage to display my information. Yay HTML, CSS, JavaScript, DOM!

Also, this is just a note for my future self but I really want to learn how to use MQTT communication to update variables in a sketch running on a microcontroller hands-free. Would I need 2 Arduino Nano’s for that?!

Resources

https://tigoe.github.io/html-for-conndev/DeviceDataDashboard/